ORIGINAL RESEARCH ARTICLE
Estimating the dog population, responsible pet ownership, and intestinal parasitism in dogs in Quito, Ecuador
C. Jaime Grijalva1,2, Julie K. Levy3*, Heather S. Walden4, P. Cynda Crawford3, William E. Pine5 and Jorge A. Hernandez1
1Large Animal Clinical Sciences, College of Veterinary Medicine, University of Florida, Gainesville, FL, USA; 2College of Veterinary Medicine, Universidad San Francisco de Quito, Quito, Ecuador; 3Maddie’s Shelter Medicine Program, College of Veterinary Medicine, University of Florida, Gainesville, FL, USA; 4Department of Comparative, Diagnostic, and Population Medicine, University of Florida, Gainesville, FL, USA; 5Department of Wildlife Ecology and Conservation, University of Florida, Gainesville, FL, USA
Abstract
Introduction: In 2011, authorities of Quito, the capital city of Ecuador, approved an ordinance to promote public health and animal welfare through responsible pet ownership promotion. The population of dogs was not known, and the relationships between dog abundance, socioeconomic factors, prevalence of zoonotic gastrointestinal parasites, and pet ownership responsibility had not been investigated. The objectives of this study were (1) to estimate the human:dog (HD) ratio, (2) to examine the relationship between household factors and responsible pet ownership, and (3) to estimate the prevalence of households with one or more dogs infected with intestinal parasites in Quito, Ecuador.
Methods: Space-based random sampling procedures were used for estimation of HD ratios in free-roaming dogs and confined owned dogs. The relationship between household factors and a Responsible Pet Ownership Index was examined using logistic regression. Dog fecal samples were tested for intestinal parasites.
Results: Among stray dogs, the observed HD ratio was 58:1. Among dogs kept indoors, the observed HD ratio was 3.5:1. A positive interaction effect between number of dogs in study households and household living conditions (a proxy for household wealth) on responsible pet ownership was observed, which we discuss in this report. Prevalence of households with dogs infected with intestinal parasites was 28% (95% confidence interval [CI] = 21–37). Ancylostoma spp. was the most frequent intestinal parasite in study dogs kept indoors.
Conclusion: This study provides new information that can be used by policy makers to formulate, implement, and evaluate public policies and education programs aimed at enhancing animal welfare and health in Ecuador.
Keywords: Dogs; population; parasites; pet ownership; Ecuador, One Health; public health
Citation: Journal of Shelter Medicine and Community Animal Health 2022, 1: 6 - http://dx.doi.org/10.56771/jsmcah.v1.6
Copyright: © 2022 C. Jaime Grijalva et al. This is an Open Access article distributed under the terms of the Creative Commons Attribution 4.0 International License (http://creativecommons.org/licenses/by/4.0/), allowing third parties to copy and redistribute the material in any medium or format and to remix, transform, and build upon the material for any purpose, even commercially, provided the original work is properly cited and states its license.
Received: 25 June 2022; Revised: 25 August 2022; Accepted: 21 September 2022; Published: 05 December 2022
Competing interests and funding: CJG was funded by Ecuador’s Secretary of Higher Education, Science, Technology and Innovation (SENESCYT), the University of Florida College of Veterinary Medicine, the Center for Latin American Studies, and the Tinker Foundation. The authors declare no potential conflicts of interest.
Correspondence: *Julie K. Levy, College of Veterinary Medicine 2015 SW 16th Avenue Gainesville, Florida, USA. Email: Levyjk@ufl.edu
Reviewers: Brian DiGangi Peter Wolf
Responsible pet ownership is a new social norm that is becoming more common in the growing, mostly urban Ecuadoran middle class.1,2 However, dog overpopulation, lack of responsible pet ownership, and the absence of animal shelter programs are continuing public health issues of concern in Quito, the capital city of Ecuador. In recent years, a number of organizations have advocated for improving pet welfare, and, in 2011, authorities in the city of Quito approved an ordinance (No. 048) to prevent cruel treatment of animals, promote responsible pet ownership, improve dog health, and reduce the risk of dog bites to people, dog defecation in public spaces, free-roaming, and unwanted animals. In recent years, the number of organizations advocating for the implementation of policies that support responsible pet ownership has increased, as well as the demand for high-quality high-volume spay-neuter (HQHVSN) clinics. Rural residence, low level of education, and low income have been identified as broad factors associated with a lack of responsible pet ownership, including normal hygienic practices, responsible breeding, pet adequate nutrition, comfortable housing, mental health, and physical health.3–6
To our knowledge, the population of dogs in Quito has not been investigated using objective research methods. In 2010 and 2013, Quito officials reported a human:dog (HD) ratio of 12:1 based on data extrapolated from published reports for capital cities in Latin America.7 However, in the absence of direct estimates for Quito, it is difficult to assess the efficacy of selected strategies identified in ordinance No. 048 (e.g. high volume spay-neuter and deworming campaigns) on dog over-population control and public health.
Few studies have measured the prevalence of dogs infected with gastrointestinal (GI) parasites in Ecuador and the Andean Region. A study on Santa Cruz, San Cristobal and Isabela Islands analyzed the prevalence was 69/97 or 71%8; the most commonly detected parasites were Ancylostoma caninum (58%) and Toxocara canis (17%). In another study on Santa Cruz in 2014, the prevalence of owned dogs infected with GI parasites was 21/56 or 38%9; the most frequently diagnosed GI parasites were Ancylostoma spp. (38%), Toxocara spp. (5%), and Cryptosporidium spp. (4%). No dogs were positive for Giardia spp.
Ancylostoma spp. is the most frequent parasite found in studies in the Andean Region.8,10 The geographic distribution of this parasite is related to the temperature of the location, and some Ancylostoma spp. are frequently found in places with a temperature higher than 20°C. Only three species of Ancylostoma are considered zoonotic: A. ceylanicum, A. caninum, and A. braziliense. A. ceylanicum is most common in humans, followed by A. caninum. A. braziliense is mainly responsible for the ‘creeping eruption’ or cutaneous larva migrans, which is the percutaneous infection of L3 larvae in humans. Human infections with Ancylostoma spp. are more common in children and adults that spend time barefoot in areas with warm and moist weather. Professionals with more risk are construction workers and gardeners since their jobs put them in direct contact with dirt that could be contaminated with L3. The organ systems involved most commonly are skin, blood, and intestine. The infection by skin of the infectious third-stage larvae of A. caninum or A. braziliense will cause skin lesions. Eosinophilic enteritis has been reported in infections with A. caninum or A. ceylanicum. Infections occur mainly by peroral infection and cause abdominal symptoms.11,12 Toxocara canis is probably the most common GI helminth that infects dogs worldwide. The reported infection rates in domestic dogs vary from 3.5% in adults to 79% in puppies. The mode of transmission in humans is ingesting eggs from contaminated soil, hands, and raw vegetables or by the consumption of undercooked meat of a paratenic host. Direct contact with infected dogs is not considered a transmission risk since the parasite ova require a period of 3 weeks to embryonate and become infective. In humans, the literature reports that infections in children are more frequent. Severe visceral larva migrans is mainly found in children 1–3 years of age. Geophagic pica is described as a major risk factor to be infected with T. canis. This behavioral disorder may affect a range of 2 to 10% of children between 1 and 6 years.11,13
In 2012, Quito authorities requested assistance in estimating the dog population and baseline data on responsible pet ownership and the burden of dogs infected with intestinal parasites in the city of Quito. The purpose of this study was to: (1) estimate the HD ratio, (2) examine the relationship between household factors and responsible pet ownership, and (3) estimate the prevalence of households with one or more dogs infected with intestinal parasites in Quito, Ecuador.
Methods
Study site
This study was conducted in the Metropolitan District of Quito, the capital city of Ecuador, during June–August 2013. The estimated human population was about 2.3 million people residing in 634,611 households.14 Quito is divided into 65 Parishes, of which 32 are located in urban areas and 33 in rural areas.
Definitions
Stray dogs were defined as those (owned or not owned) observed as free-roaming15 without direct human supervision, by one of the authors (CJG) between 4:00 am and 6:00 am on 1 or 2 consecutive days during the study.
Confined owned dogs were those declared as owned by the household chief and kept indoors or inside household (property) limits, during house-to-house visits by the same author between 10.00 am and 12.00 pm. Some confined owned dogs were reported as being allowed to roam free (with or without supervision) in public spaces to play or defecate during mornings and evenings, and that information was recorded. A household was a housing unit composed by those living together under the same roof (e.g. home or apartment). The household chief was the person who was in charge of the household at the moment of the data collection. Commercial food was food manufactured for the purpose of feeding dogs produced by the industry that generally has a veterinarian specialist in nutrition behind the formulation. Specially prepared food was defined as fresh food specially prepared by the dog owner for the dogs in the household.
Sampling and counting of stray dogs
A representative sample of parishes was selected from a map starting with one Parish roughly located in the center. Then, each Parish was identified with one of four colors (avoiding assignment of the same color to adjacent Parishes) (Fig. 1).16,17 This approach identified three groups of 16 Parishes and one group of 17 Parishes (with one color for each group). Second, one of four colors was randomly selected to identify one group of study Parishes. Eight of 16 selected Parishes (Rumipamba, Mariscal Sucre, La Magdalena, La Ecuatoriana, Carcelén, San Isidro del Inca, Puengasí, and Solanda) were located in urban areas and eight more (La Merced, Nanegalito, Chavezpamba, Yaruquí, Conocoto, Calderón, Calacalí, and Nayón) in rural areas. Third, within each selected Parish, Sections were created using Google Earth®. Each Section had a walking distance of approximately 5 km on public routes and was identified with a unique number. Each Parish had a median number of 25 Sections (range: 3–90). Two Sections were then randomly selected where free-roaming dogs were to be counted using random numbers from a computer algorithm (available at http://www.randomizer.org).
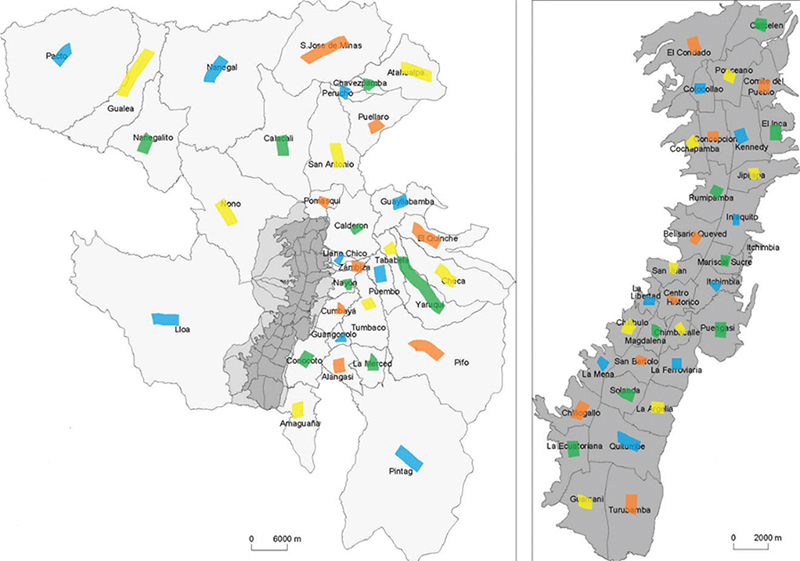
Figure 1. Geographic location of 65 Parishes in the metropolitan area of Quito. Left figure shows 33 Parishes in rural areas. Right figure shows 32 Parishes in urban areas. Each Parish was assigned to 1 of 4 colors (blue, yellow, green, and orange). Next, one of four colors (green) was randomly selected to identify 16 Parishes that were included in the study. Eight urban Parishes (Rumipamba, Mariscal Sucre, La Magdalena, La Ecuatoriana, Carcelén, San Isidro del Inca, Puengasí, and Solanda) and eight rural Parishes (La Merced, Nanegalito, Chavezpamba, Yaruquí, Conocoto, Calderón, Calacali, and Nayón) were included in the study.
Counting of stray dogs was conducted by one author (CJG) on a total of 32 Sections (two selected Sections × 16 Parishes = 32 Sections). Each Section was walked at an average speed of 4 km/h on 2 consecutive days (e.g. Monday and Tuesday) between 4:00 am and 6:00 am. A metropolitan police officer accompanied the surveyor for safety. This time period was selected because it is a reported period during which dogs search for food, defecate without dog owner supervision, and avoid morning car traffic.16 A tally counter was used to count dogs each day (e.g. ‘captured’ dogs). An Earthmate® PN 60 GPS device was used to record the track followed the first day, and the same track was followed the second day. Dogs that were counted were registered on a digital photographic archive using a Canon® PowerShot D20 camera equipped with a Global positioning system (GPS) device. The photographic archive and a second tally counter were used to identify dogs observed on both observation days (e.g. ‘recaptured’ dogs).
Sampling and counting of confined owned dogs
Within each selected Parish (n = 16) and each selected Section (n = 32), all Blocks (approximately 14 Blocks per section) were considered for inclusion, but only one Block per Section was randomly selected and included in the study for a total of 32 Blocks. All households in selected Blocks were visited for a personal interview with the household chief. Participation in the personal interview was voluntary, and only household chiefs who approved and signed a consent form were included in this study. Blocks in rural Parishes were not clearly defined. Thus, all households in the selected Section were targeted for inclusion in the study.
Collection of fecal samples and diagnosis of intestinal parasites in confined owned dogs
During house-to-house visits, each household chief was instructed to collect one fecal sample from at least one of her/his dog(s) from the ground, after normal defecation. On a first home visit (day 1), the household chief was provided with two pairs of gloves, a disposable tongue depressor and two sterile plastic specimen containers (100 mL) labeled with the dog’s name and date. Participant dog owners were instructed how to safely collect dog fecal samples. If canine fecal samples were visible in the home backyard, he/she was provided with zip-lock bags and instructed to safely collect a dog fecal sample from the ground by turning the bag inside out. All fecal samples were collected the following day (day 2) and submitted to a designated laboratory at the University of San Francisco de Quito for the identification of intestinal parasites. The parasitological exam consisted in identification of morphological characteristics of parasite eggs, cysts, and oocysts using a Sheather’s sugar centrifugational flotation and sedimentation techniques.9 Initial diagnosis and identification of intestinal parasites were conducted by one author (CJG) and confirmed by a parasitologist (HSW).
Data collection
Poverty rates published in Ecuador’s National Population and Housing Census in 2010 were collected for each study parish. For each study household, the following data were collected: date of interview; Parish identification; residence (urban, rural); number of people in the household; number of dogs in the household; household with one or more dogs with a positive diagnosis of intestinal parasites (yes, no); Responsible Pet Ownership Index (RPOI) (score 1 to 8); and living condition index (LCI) (score 1 to 9). Finally, for each study dog, the following data were collected: dog name, age, sex (male, female), spay neuter status (yes, no), free-roam (yes, no), dog is walked with a leash (yes, no), adequate shelter (yes, no), feeding (commercial food, specially prepared food, scrap food from human meals), dog visited veterinary clinic once in the last 12 months (yes, no), dog was dewormed in the last 6 months (yes, no), and last time dog was vaccinated against rabies (months, don’t know).
An instrument was prepared to measure a RPOI in each study household (Table 1). The instrument included eight parameters: (1) spayed/neuter status; (2) use of leash; (3) dog shelter conditions; (4) food; (5) veterinary care; (6) rabies vaccination compliance; (7) deworming; and (8) allowance to free roaming. Scores of 0 to 1 or 0 to 2 were assigned to each parameter for a maximum score of 8 in each household. An instrument was prepared to measure a LCI as a proxy for wealth in each study household (Table 2). The instrument included two parameters: (1) accumulated wealth (PC, e-mail account, TV, and cars) and (2) education (elementary school, middle school, high school, and university). Scores of 0 to 4 were assigned to each parameter, except for number of cars, for a maximum score of 9.
Data analysis
Stray dogs
Within each selected Section, the proportion of observed stray dogs during the first and second observations (e.g. ‘recaptured’ dogs) was calculated using data collected with the second tally counter and GPS camera.16,18 The Chapman modified Lincoln-Petersen equation19 (Equation 1) was used to estimate the number of dogs.20

where n1 is the number of dogs observed during the first day (captured dogs), n2 is the number of dogs observed the next day, m2 is the number of dogs observed during the second day that were also seen in the first day (e.g. ‘recaptured’ dogs), and N is the estimated number of animals in each section. The rationale for using this method for counting dogs is to estimate the proportion of ‘recaptured’ dogs during the second count (m2/n2); the assumption is that this proportion is the same as that in the population at large (n1/N). Ninety-five percent confidence intervals (CI) were estimated by using the Poisson distribution because data were not normally distributed, and the number of recaptures was less than 50 in study Parishes.19 CIs using the two-sample method20 were only determined for residence (urban, rural) and for the total count since only four of 32 study Sections had a required number of ≥8 recaptured dogs.
To estimate number of dogs in each selected Parish, the estimated numbers of dogs on Sections 1 and 2 were averaged and then multiplied by the total number of Sections in each selected Parish. To calculate the HD ratio in each study Parish, the official human population was divided by the estimated dog population. The sampling fraction method was used to estimate the overall number of dogs by residence in studied Parishes (urban, rural).16 Overall HD ratios by residence were calculated dividing the official human population by the estimated dog population. The overall dog population estimate in all sampled Parishes and the estimated HD ratio for Quito were calculated using the same method. The relationship between the abundance of free-roaming dogs (HD ratio) (rank data) and social poverty rates (rank data) in study Parishes (n = 16) was examined using simple linear regression.
Confined owned dogs
The observed HD ratio was calculated by dividing the total number of people by the total number of dogs in study households. The variables for number of dogs and number of people in study Parishes (n = 16) were normally distributed. Thus, simple linear regression was used to calculate a beta coefficient to produce an additional HD ratio (i.e. 1 divided by the beta coefficient) and 95% CI derived from the regression results.
The median time of last rabies vaccination and deworming was computed. The Wilcoxon sign rank test was used to calculate 95% CI. The frequency of dogs that were examined by a veterinarian within the last year was determined.
The association between RPOI and investigated household factors was examined using unconditional logistic regression.9,21 Study households were assigned into one of two groups with a low (0 to 5) or high (6 to 8) RPOI scores – based on the median distribution.
Prevalence of and identification of exposure factors associated with intestinal parasitism in confined owned dogs
Prevalence of households with ≥1 dogs with a positive diagnosis of intestinal parasites was calculated as the number of households with a positive diagnosis divided by the total number of households with dogs sampled and tested. In addition, the prevalence of dogs with a positive diagnosis of intestinal parasites was calculated as the number of dogs with a positive diagnosis divided by the total number of dogs sampled and tested; 95% CI were calculated for each prevalence estimate assuming normal distribution.22 Finally, the relationship between investigated household factors and households with one or more dogs classified as infected with intestinal parasites was examined using unconditional logistic regression.
Results
Stray dogs
The estimated number of stray dogs in the 32 study Sections was 726 (95% CI = 653–822). Overall, the HD ratio was 58:1 (95% CI = 52:1–65:1). The abundance of stray dogs was higher in rural Parishes (HD ratio = 47:1; 95% CI = 39:1–55:1) compared to urban Parishes (HD ratio = 73:1; 95% CI = 61:1–84:1) (Tables 3 and 4). Using linear regression, the HD ratio was associated with social poverty rates in study Parishes (β = −0.77; r = 0.77; R2 = 0.59; P < 0.01); that is, lower HD ratios (more dogs) were associated with higher poverty rates. Overall, the observed HD ratio (58:1) indicates that the population of free-roaming dogs was 36,207 in Quito in June–August 2013.
| Parish | Section 1 | Section 2 | Mean Dogs in sections 1&2 | Estimated human population in section | Estimated human:dog ratio in Parish | ||||||||
| n1 | n2 | m2 | N | 95%CI | n1 | n2 | m2 | N | 95%CI | ||||
| Urban | |||||||||||||
| S.I. Inca | 14 | 16 | 8 | 27 | 18−38 | 11 | 8 | 1 | 53 | 40−68 | 40 | 978 | 24:1 |
| Ecuatoriana | 23 | 28 | 15 | 43 | 32−57 | 30 | 27 | 15 | 53 | 40−68 | 48 | 1833 | 38:1 |
| Puengasí | 9 | 13 | 3 | 34 | 24−47 | 14 | 12 | 4 | 38 | 26−51 | 36 | 1456 | 40:1 |
| Magdalena | 3 | 3 | 0 | 15 | ND | 16 | 18 | 7 | 39 | 28−52 | 27 | 1893 | 70:1 |
| Carcelén | 14 | 14 | 5 | 37 | 26−50 | 1 | 0 | 0 | 1 | 1−8 | 19 | 2113 | 113:1 |
| Solanda | 7 | 7 | 1 | 31 | 21−44 | 10 | 6 | 2 | 25 | 17−36 | 28 | 4349 | 156:1 |
| Rumipamba | 0 | 3 | 0 | 3 | ND | 0 | 1 | 0 | 1 | ND | 2 | 1739 | 869:1 |
| Mariscal | 0 | 1 | 0 | 1 | ND | 0 | 1 | 0 | 1 | ND | 1 | 998 | 998:1 |
| Rural | |||||||||||||
| La Merced | 16 | 21 | 3 | 93 | 76−113 | 5 | 3 | 2 | 7 | 3−14 | 50 | 271 | 5:1 |
| Nanegalito | 6 | 3 | 3 | 6 | 3−13 | 2 | 5 | 0 | 17 | ND | 12 | 112 | 10:1 |
| Calacalí | 1 | 8 | 0 | 17 | ND | 2 | 0 | 0 | 2 | 1−7 | 10 | 169 | 18:1 |
| Nayón | 22 | 15 | 6 | 52 | 38−67 | 10 | 18 | 6 | 29 | 19−41 | 40 | 920 | 23:1 |
| Chavezpamba | 8 | 8 | 4 | 15 | 8−24 | 5 | 2 | 2 | 5 | 2−12 | 10 | 267 | 26:1 |
| Calderón | 25 | 27 | 13 | 51 | 38−69 | 5 | 7 | 4 | 9 | 5−17 | 30 | 1692 | 57:1 |
| Yaruquí | 8 | 4 | 2 | 14 | 8−23 | 6 | 8 | 5 | 10 | 5−18 | 12 | 1050 | 89:1 |
| Conocoto | 4 | 3 | 2 | 6 | 3−13 | 4 | 9 | 2 | 16 | 10−25 | 11 | 1052 | 99:1 |
| n1 = dogs observed in the first count (captured dogs). | |||||||||||||
| n2 = dogs observed in the second count. | |||||||||||||
| m2 = dogs observed in both counts (recaptured dogs). | |||||||||||||
| N = [ (n1 + 1) (n2 + 1) / (m2 + 1)] – 1.20 | |||||||||||||
Confined owned dogs
Among the 32 selected Blocks, 232/998 (23%) households voluntarily participated in this study. The proportions of surveyed households were significantly different in urban (126/701 or 18%) and rural neighborhoods (106/297 or 36%) (P < 0.01). A total of 194/232 or 84% household chiefs reported having one or more dogs for a total of 318 dogs. The median age of dogs was 2 years (minimum = 6 weeks, first quartile = 1 year; third quartile = 4 years, maximum = 16 years). A total of 195 dogs (61%) were male, and 44 dogs (14%) were spayed or neutered. The proportion of neutered male dogs (20/194 or 10%) was lower compared to female spayed dogs (24/122 or 20%) (P = 0.02). Furthermore, 71 dogs (22%) were reported as allowed to free roam in public spaces. The proportion of dogs allowed to roam in public places was higher in rural Parishes (36%) compared with urban Parishes (11%). Dogs in rural parishes were four times more likely to roam compared with urban parishes (odds ratio [OR] = 4.4; 95% CI = 2.5–8.0; P < 0.01). The proportion of free-roaming males was higher (54/194 or 28%) compared with females (17/124 or 14%) (P < 0.01). The proportion of owned free-roaming spayed females was higher (6/20 or 30%) than the males (1/24 or 4%) (P = 0.03).
The observed abundance of confined owned dogs was similar in urban Parishes (HD ratio = 3.2:1) and rural Parishes (3.3:1). The proportion of dogs that were examined by a veterinarian within the last year was 187/319 or 59% (95% CI = 53–64%; P < 0.01). The median time from last deworming was 4 months (pseudo median 4.5; 95% CI = 4.0–5.0). The median time from last rabies vaccination was 4 months (pseudo median 4.5; 95% CI = 4–5).
Using linear regression, the estimated correlation between number of dogs and number of people in participant households (r) was 0.94, and the beta coefficient was 0.29 (95% CI = 0.23–0.34) (standard error [SE] = 0.02) (Fig. 2). In addition, using an estimated HD ratio of 3.5:1 (i.e. 1/beta coefficient) and a human population of 2,239,191, the estimated population of confined owned dogs in Quito was 649,365 (95% CI = 515,014 – 761,325).
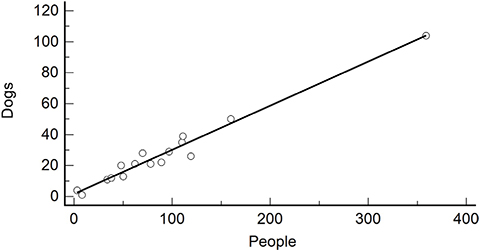
Figure 2. Scatter diagram showing an association between number of people and number of confined owned dogs counted in 16 study Parishes in Quito.
Household factors associated with Responsible Pet Ownership
The variable for RPOI in a household was associated with the variables for residence type (urban, rural), number of dogs, and LCI (P < 0.01). In addition, the variable for LCI was associated (P < 0.01) with residence type. Thus, the explanatory variables for number of dogs in a household and LCI were further examined.
The combined effect of number of dogs in the household and LCI on RPOI revealed that households with ≥2 dogs and low LCI were 17 times more likely to have a low RPOI compared with households with 1 dog and high LCI (OR = 16.7; 95% CI = 5.9–47.4; P < 0.01). This observed combined effect on low RPOI (OR = 16.7) was higher than the expected combined effect based on adding (OR = 7.4) and multiplying (OR = 11.9) absolute independent excesses due to LCI (OR = 2.4) or (OR = 5.0) number of dogs in the household (Table 5).
Intestinal parasites in confined owned dogs
A total of 110 of 194 (57%) households with one or more dogs returned a dog fecal sample. Thirty-one of 110 or 28% (95% CI = 21–37) study households had one or more dogs classified as infected with one or more intestinal parasites. Using univariable logistic regression, the odds of household with dogs infected with intestinal parasites was two times higher in households with low RPOI scores compared with households with high RPOI scores; however, this association was not significant (crude OR = 2.1; 95% CI = 0.9–4.9; P = 0.09). Other investigated household factors were not associated with a positive diagnosis of intestinal parasites (P ≥ 0.12).
At the dog level, 39 of 154 or 25% (95% CI = 19–33) dogs were infected with one or more intestinal parasites (Table 6). Ancylostoma spp. was the most frequent parasite diagnosed in dogs (18/154 or 12%; 95% CI = 7–17) followed by Toxocara canis (11/154 or 7%; 95% CI = 4–12). Finally, eight (5%) dogs were diagnosed as infected with two intestinal parasites (95% CI = 2–9). In urban households, the prevalence of dogs with Ancylostoma spp. was 9/59 or 15% (95% CI = 8–27) similar (P = 0.7) to rural households, which was 9/51 or 18% (95% CI = 9–31).
| Parasite | Frequency |
| Ancylostoma spp. | 18 |
| Toxocara canis | 11 |
| Cystoisospora spp. | 1 |
| Trichuris spp. | 1 |
| Co-infections | 8 |
Discussion
Overall, the estimated HD ratio of stray dogs was 58:1, and their abundance was higher in rural Parishes compared with urban Parishes. In addition, a higher abundance of stray dogs was associated with higher poverty rates in study Parishes. These findings are in agreement with previous observations that a higher abundance of stray dogs is associated with low- or middle-income neighborhoods in Baltimore, Maryland, between 1970 and 1971.23 In another study conducted in rural households in Yucatan, Mexico, 77% of study households did not have adequate fences to prevent dogs from roaming.3 Although the variable for inadequate fences was not measured in this study, households with inadequate fences or no fences are commonly observed in rural Parishes in Quito. To our knowledge, no other published studies have estimated the abundance of stray dogs relative to the human population in Quito.
Among 998 selected households, 232 or 23% were surveyed, and the proportion of surveyed households was different between urban (18%) and rural (36%) neighborhoods. The response rate was lower in this study than a survey on Santa Cruz Island, Galapagos in September 2014 (166/227 or 73%).9 It is possible that this was due in part to the lack of government officials participating in the current survey. The prevalence of crime against people in Quito (22%) is higher than in the Galapagos (7%); consequently, residents may be more reluctant to open the door to a stranger in Quito.24
Among 232 study households, the observed HD ratio was 3.5:1. The observed HD ratio in Quito is smaller than that reported by city officials in Quito in 2010 and 2013 (12:1)25 and in previous studies in Guayaquil, Ecuador in 1986 (7:1),26 Santa Cruz Island, Ecuador in 2014 (6:1),9 and Santa Cruz Island in 2016 (4.8).27 All the cited studies had differences in methodologies for data collection and statistical analysis. Between 2009 and 2011 in Quito, city officials estimated HD ratio based on rates reported in other Latin American capital cities similar to Quito. On the other hand, in Guayaquil, Beran and Frith surveyed 1,938 homes in 394 randomly selected squares of the city.21 Another approach was used in Santa Cruz, Galapagos.9 Explanations for a lower population in Santa Cruz, Galapagos, could include the effects of the dog importation prohibition or a higher prevalence of sterilized dogs (40%) compared to Quito (14%).9,28
We observed a positive interaction effect between ≥2 dogs in study households and a low household LCI on responsible pet ownership. This finding can be explained by education and economic factors at the household level, which can influence compliance for responsible pet ownership as desired by policy makers in Quito. Low-income families may not have the financial means or access to veterinary services. Finally, family budgets can be further compromised with a higher number of dogs on the household. In a similar study developed in Pelotas, Brazil, 1,558 households were examined for responsible pet ownership. Using similar parameters to develop a score for responsible pet ownership, they found an association between level of education of the household chief (P < 0.001) and low RPOI.29 To our knowledge, no other published studies have examined the relationship between socioeconomic drivers and responsible pet ownership as defined in this study.
At the dog level, 25% of dogs were infected with one or more intestinal parasites, with Ancylostoma spp., the most common parasite, identified in 12%. The observed burden of Ancylostoma spp. in dogs in Quito, Ecuador, during June–August 2013 was lower compared with that in dogs on Santa Cruz Island, Galapagos, Ecuador, in September 2014 (21/56 or 38%; 95% CI = 25–50%).9 On Santa Cruz Island, the frequency of dogs infected with Ancylostoma spp. was higher in rural neighborhoods compared with urban neighborhoods; one explanation offered by Diaz et al. was that environmental conditions (greater exposure and longer survival in soil) are more favorable in rural than in urban neighborhoods in Santa Cruz Island.9 In this study, the prevalence of Ancylostoma spp. was similar in urban households compared to rural households. An explanation for this can be that the samples were taken during the dry season of Quito. Also, there is no major difference in the weather and altitude between the studied sections with the exception of Nanegalito.30 Ancylostoma spp. is often the most frequent parasite found in dog studies in the Andean Region countries with a prevalence of 22% in Maracaibo, Venezuela, 14% in Quindio, Colombia, 38% in Santa Cruz, and 58% in Isabela, Galápagos.8–10,31
This study had several limitations. First, it is possible that some dogs classified and counted as stray dogs were also classified and counted as confined owned dogs; if this scenario were real, the risk of misclassification can be low (if most confined owned dogs are not allowed to roam free between 4:00 am and 6:00 am) or high (if most confined owned dogs are allowed to roam free during that time). Second, counting of stray dogs was limited to two of a median of 25 sections per selected Parish during 2 consecutive days, in a narrow time frame between 4:00 am and 6:00 am. In addition, among confined owned dogs, the number of surveyed households was low (23%). It is possible that the inclusion of more study sections and additional days of stray dog counting, as well as a higher number of surveyed households with confined dogs could have produced more accurate and precise HD ratio estimates, but time and budget limitations prevented a more robust sampling approach. Third, instruments used to measure responsible pet ownership and living conditions in study households were not validated. Thus, study results should be interpreted with caution, as they reflect levels of dog’s supervision, spay-neuter status, housing conditions, and veterinary care, as well as ownership of selected home electronics, own transportation, and years of education as measured in this study. Finally, the burden of dogs infected with intestinal parasites was based on one fecal sample collected during the study period. The collection and testing of a second fecal sample could have mitigated the risk of false negative results.
Conclusions
This study provides new data and information that can be used by Quito policymakers to formulate, implement, and evaluate public policies and education programs aimed at enhancing animal welfare and health, as defined in Quito’s ordinance (No. 048). Among stray dogs, the observed HD ratio was 58:1, which extrapolates to 36,207 in June–August 2013. In addition, among confined owned dogs, the observed HD ratio was 3.5:1, which extrapolates to 649,365. Among confined owned dogs, 39 of 154 or 25% dogs were infected with one or more intestinal parasites. Ancylostoma spp. was the most frequent intestinal parasite diagnosed in infected dogs (18/39 or 46%) – a parasite in dogs that can be transmitted to humans, particularly children.
Author contributions
C. Jaime Grijalva, a passionate advocate for animal welfare and public health, passed away in 2022. CJG, JAH, JKL, and PCC conceptualized the project and designed the study. CJG led the field studies (dog counting and household surveys) and curated the data. CJG, JAH, and WEP performed the population modeling and statistical analysis. HSW performed parasite identification, CJG prepared the original manuscript draft, and JKL, JAH, HSW, WEP, and PCC reviewed and edited the manuscript.
Statement of ethics
This study was approved by the Universidad San Francisco de Quito’s Bioethics Committee, the University of Florida Institutional Animal Care and Use Committee, and the University of Florida Institutional Review Board.
Acknowledgements
The College of Veterinary Medicine at Universidad San Francisco de Quito generously provided laboratory space for processing of fecal samples and diagnosis of intestinal parasites in dogs. The City of Quito’s Metropolitan Police Department provided assistance during the survey of stray dogs in study neighborhoods.
References
| 1. | Castellanos G. Adopciones y eutanasias, las dos caras del bienestar animal. El Comercio. 1/29/16. Accessed June 25, 2022. https://www.elcomercio.com/tendencias/adopciones-eutanasias-cifras-ecuador-animalescallejeros.html. |
| 2. | En La Joya Crean Escuela de Tenencia Responsable de Mascotas. El Universo. Accessed June 25, 2022. https://www.eluniverso.com/noticias/2017/02/16/nota/6049051/joya-crean-escuela-tenencia-responsable-mascotas/2/16/17. |
| 3. | Ortega-Pacheco A, Rodriguez-Buenfil JC, Bolio-Gonzalez ME, Sauri-Arceo CH, Jiménez-Coello M, Forsberg CL. A Survey of Dog Populations in Urban and Rural Areas of Yucatan, Mexico. Anthrozoos. 2007;20:261–274. doi: 10.2752/089279307X224809 |
| 4. | Slater MR, Di Nardo A, Pediconi O, et al. Free-Roaming Dogs and Cats In Central Italy: Public Perceptions of the Problem. Prev Vet Med. 2008;84:27–47. doi: 10.1016/j.prevetmed.2007.10.002 |
| 5. | Acosta-Jamett G, Cleaveland S, Cunningham AA, Bronsvoort BM. Demography of Domestic Dogs in Rural and Urban Areas of the Coquimbo Region of Chile and Implications for Disease Transmission. Prev Vet Med. 2010;94(3–4):272–281. doi: 10.1016/j.prevetmed.2010.01.002 |
| 6. | Overgaauw PAM, Vinke CM, Hagen MAEV, Lipman LJA. A One Health Perspective on the Human-Companion Animal Relationship with Emphasis on Zoonotic Aspects. Int J Environ Res Public Health. 2020;17:3789. doi: 10.3390/ijerph17113789 |
| 7. | Jácome E. Perros Muertos, Problema de Salud, El Comercio, Cuaderno No. 2. 2013:1321. |
| 8. | Gingrich EN, Scorza AV, Clifford EL, Olea-Popelka FJ, Lappin MR. Intestinal parasites of dogs on the Galapagos Islands. Vet Parasitol. 2010 May 11;169(3–4):404–407. doi: 10.1016/j.vetpar.2010.01.018 |
| 9. | Diaz NM, Mendez GS, Grijalva CJ, et al. Dog overpopulation and burden of exposure to canine distemper virus and other pathogens on Santa Cruz Island, Galapagos. Prev Vet Med. 2016;123:128–137. doi: 10.1016/j.prevetmed.2015.11.016 |
| 10. | Ramírez-Barrios RA, Barboza-Mena G, Muñoz J, et al. Prevalence of intestinal parasites in dogs under veterinary care in Maracaibo, Venezuela. Vet Parasitol. 2004;121:11–20. doi: 10.1016/j.vetpar.2004.02.024 |
| 11. | Overgaauw PAM, van Knapen F. Dogs and nematode zoonoses. In: Macpherson CNL, Meslin FX, Wandeler AI, editors. Dogs, Zoonoses, and Public Health. New York: CABI Pub; 2000:213–256. doi: 10.1079/9780851994369.0000 |
| 12. | Bowman DD, Montgomery SP, Zajac AM, Eberhard ML, Kazacos KR. Review: Hookworms of Dogs and Cats As Agents of Cutaneous Larva Migrans. Trends Parasitol. 2010;26(4):162–167. doi: 10.1016/j.pt.2010.01.005 |
| 13. | Moreira GM, Telmo Pde L, Mendonça M, et al. Human Toxocariasis: Current Advances in Diagnostics, Treatment, and Interventions. Trends Parasitol. 2014;30:456–564. doi: 10.1016/j.pt.2014.07.003 |
| 14. | Instituto National de Estadistica y Censos. Base de Datos-Censo de Población y Vivienda 2010. Accessed June 25, 2022. https://www.ecuadorencifras.gob.ec/base-de-datos-censo-de-poblacion-y-vivienda-2010/. |
| 15. | World Organisation for Animal Health. Terrestrial Animal Health Code: Glossary. 19 July, 2021. Accessed June 25, 2022. https://www.woah.org/fileadmin/Home/eng/Health_standards/tahc/current/glossaire.pdf. |
| 16. | World Society for the Protection of Animals. Surveying Roaming Dog Populations: Guidelines on Methodology. 2007. Accessed June 25, 2022. https://caninerabiesblueprint.org/Guidelines-on-surveying-roaming. |
| 17. | Hossain M, Ahmed K, Marma AS, et al. A Survey of the Dog Population in Rural Bangladesh. Prev Vet Med. 2013;111: 134–138. doi: 10.1016/j.prevetmed.2013.03.008 |
| 18. | Dias RA, Guilloux AG, Borba MR, et al. Size and Spatial Distribution of Stray Dog Population in the University of São Paulo Campus, Brazil. Prev Vet Med. 2013;110:263–273. doi: 10.1016/j.prevetmed.2012.12.002 |
| 19. | Krebs CJ. Ecological Methodology. 2nd ed. Menlo Park, CA: Benjamin Cummings; 1998. |
| 20. | Greenwood JD, Robinson RA. Principles of Sampling. In: Sutherland WJ, ed. Ecological Census Techniques: A Handbook. 2nd ed. Cambridge: Cambridge University Press; 2006: 11–86. |
| 21. | Szklo M, Nieto FJ. Defining and Assessing Heterogeneity of Effects: Interaction. In: Epidemiology: Beyond Basics. Gaithersburg, MD: Aspen Publishers Inc; 1999: 211–253. |
| 22. | Dean AG, Sullivan KM, Soe MM. OpenEpi: Open Source Epidemiologic Statistics for Public Health. Accessed June 25, 2022. https://www.openepi.com/Proportion/Proportion.htm. |
| 23. | Beck AM. Ecology of Stray Dogs: A Study of Free-Ranging Urban Animals. West Lafayette, IN: Purdue University Press; 1973. |
| 24. | Encuesta de Victimización y Percepción de Inseguridad 2011. Instituto National de Estadistica y Censos. Accessed June 25, 2022. https://www.ecuadorencifras.gob.ec/encuesta-de-victimizacion-y-percepcion-de-inseguridad-2011/. |
| 25. | Wray N. Se Aprueba Ordenanza Sobre Control de Animales en Quito. 4/14/2000. Accessed June 25, 2022. https://normanwray.wordpress.com/2011/04/14/se-aprueba-ordenanza-sobre-control-de-animales-en-quito/. |
| 26. | Beran GW, Frith M. Domestic Animal Rabies Control: An Overview. Rev Infect Dis. 1988;10 Suppl 4:S672–S677. doi: 10.1093/clinids/10.supplement_4.s672 |
| 27. | Diaz NM, Walden HS, Yoak A, et al. Dog overpopulation and diagnosis of intestinal parasites on Santa Cruz Island, Galapagos 2016. Prev Vet Med. 2018 Sep 1;157:99–104. doi: 10.1016/j.prevetmed.2018.06.003 |
| 28. | Ley Organica de Regimen Especial de la Provincia de Galapagos. Oficio No. 520 30. Asamblea Nacional de la Republica del Ecuador; 2015. Accessed June 25, 2022. https://www.turismo.gob.ec › LOREG-11-06-2015. |
| 29. | Domingues LR, Cesar JA, Fassa AG, Domingues MR. [Responsible Pet Animal Guardianship in the Urban Area of the Municipality of Pelotas in the State of Rio Grande do Sul, Brazil]. Cien Saude Colet. 2015 Jan;20(1):185–192. doi: 10.1590/1413-81232014201.19632013 |
| 30. | Anuario Meteorológico. Instituto Nacional de Meteorología e Hidrología. 2014. Accessed June 25, 2022. https://www.docsity.com/es/anuario-meteorologico-2011/5137275/. |
| 31. | Giraldo MI, García NL, Castaño JC. [Prevalence of Intestinal Helminths in Dogs from Quindío Province]. Biomedica. 2005;25:346–352. doi: 10.7705/biomedica.v25i3.1359 |