ORIGINAL ARTICLE
Veterinary care deserts: what is the capacity and where is it?
Sue M. Neal1,2 and Mike J. Greenberg1
1Veterinary Care Accessibility Project, Rochester, MI, USA; 2Center for GIS and Spatial Analysis, West Chester University of Pennsylvania, West Chester, PA, USA
Abstract
Introduction: Access to veterinary care is a complex issue that lies at the intersection of socioeconomics, culture, and space. Although there has been substantial research that has explored factors that impede access to care, the issue has not been well addressed from a geographic perspective. Access deserts is a familiar concept that has been applied to human health care, access to nutritious foods, etc. Thus, there is value in conceptualizing access to veterinary care through the same lens. This research aims to advance the effort of identifying veterinary care deserts by specifying normative values for two fundamental parameters: the ratio of care providers to measures of the population and the catchment of clinics.
Methods: Total employees at veterinary clinics were aggregated at the county level and normalized by different measures of human and companion animal population. All clinic employees are included under the assumption that increased support staff increases the overall care capacity. Weighted means were generated and reported for each approach. The number of veterinary clinic employees needed in each county in order to reach the weighted mean for the overall country is also reported both at the county level and state level. Clinic catchment was measured by evaluating the mean distance traveled using data from a large number of clinics and clinic clients. The data were further analyzed using Rural Urban Commuting Areas (RUCA) classifications.
Results: Veterinary employee shortages were observed ranging from 20,000 to 60,000 employees depending on how the data are viewed. Parameters for the weighted mean number of employees were reported in a detailed chart. Results of the distance analysis indicate that most people travel between 2 and 6 miles to reach clinics.
Conclusion: This research indicates spatial disparities in the distribution of veterinary staff. The parameters of the ratio of employees to population measures and distance traveled can both be used in future research that aims to identify local and regional veterinary care deserts. This analysis could be further enhanced by the addition of factors such as socioeconomic data or social determinants of health to further define and identify care deserts.
Keywords: access to veterinary care; veterinary care desert; distance to veterinary clinic; care desert parameters; veterinary care desert definition
Citation: Journal of Shelter Medicine and Community Animal Health 2022, 1: 2 - http://dx.doi.org/10.56771/jsmcah.v1.2
Copyright: © 2022 Sue M. Neal and Mike J. Greenberg. This is an Open Access article distributed under the terms of the Creative Commons Attribution 4.0 International License (http://creativecommons.org/licenses/by/4.0/), allowing third parties to copy and redistribute the material in any medium or format and to remix, transform, and build upon the material for any purpose, even commercially, provided the original work is properly cited and states its license.
Received: 24 June 2022; Revised: 30 July 2022; Accepted: 2 August 2022; Published: 12 October 2022
Competing interests and funding: The authors declare that the research was conducted in the absence of any commercial or financial relationships that could be construed as a potential conflict of interest. No funding was received in support of this research.
Correspondence: Sue M. Neal, Email: sneal@astate.edu
Reviewers: Kimberly Woodruff, Margaret Slater
Fewer contacts with veterinarians can be a significant concern to the welfare of companion animals.1 The impact of this problem on animal welfare and the scale of the problem have led many animal welfare leaders to declare that access to care is the most important problem currently confronting animal welfare.2 Despite the importance of access to veterinary care for the health and wellbeing of companion animals, little research has been done to determine how to measure access and identify areas that could be considered access deserts, with a particular lack of analysis from a geospatial perspective.1 This research seeks to fill this key gap by specifying parameters that are typically used in defining care deserts in the human health canon and quantifying the predicted gap in care providers at the county and state levels in the contiguous United States.
It has been shown that many people consider companion animals as part of their family3 and that not being able to access care may result in the surrender of the animal to a shelter, euthanasia, or prevent one from obtaining an animal.2 This indicates that having access to veterinary care can be a benefit to both the animals themselves and their human caregivers.
Companion animal medicine is an evolving industry. Recent years have seen a shift from the small, individual practice veterinary clinic to larger, consolidated practices. This has the potential effect of furthering the spatial disparities in access to care if it reduces the spatial dispersion of clinics from isolated, single-practice clinics to larger, single-site facilities. The effect of consolidation on the number of clinics is not well documented; however, the American Veterinary Medical Association (AVMA) reports that the number of practices that employ 10 more people has ‘sharply increased during the period 2010–2016, (p. 7)’.2,4 Contrasting with this is the decline in individual proprietorships. During the period 2010–2013, individual proprietorships decreased by 11%, and an additional 12% decline was observed during the period 2013–2016.4
The question of whether there is a lack of adequate supply in the industry remains unanswered. A 2018 report by the AVMA surveyed practice owners about the number of veterinarians in their area relative to the market capacity. The results of the survey indicated that roughly half of the practice owners felt that the supply was just right, whereas 37% felt there were too many or even far too many veterinarians in their area of business. Nearly 45% felt that the number of practices exceeded the market capacity in their local market.4 What this does not address is any supply shortage in areas without an existing business to act as a survey response point. This could result in bias in the survey population due to the historical patterns of where clinics tend to be located. For example, research suggests that practice owners may avoid opening businesses in low-income areas or inner-cities that may be perceived as a sub-optimal business environment due to economic insecurity,5 and that rural veterinarians face a variety of challenges that may make positions less desirable.6 A report by the Humane Society of the United States argues that these communities are broadly underserved by the animal welfare community writ large.7 Furthermore, as previously discussed, demand for service is influenced by barriers to care beyond spatial proximity. Thus, if care is not affordable or if clients lack transportation, the demand for service may be lower. Hence, it is important to think about the distribution as a function of ‘need’ more than actual demand. The need for an animal to have appropriate medical care is quite separate from the caregiver’s ability to supply access to the service.
The analysis done in this research provides an objective method to assess the availability of care providers in any given county and aggregately at the state level. The results are presented in a number of different ways, allowing future researchers to choose the parameter specifications that best match the research design they are using, the geographic unit of analysis, and comfort with the limitations and assumptions. Furthermore, the distance that clients travel to reach service providers is also specified. When combined, these two parameters enable future research around geospatial access to veterinary care. Furthermore, these parameters can be combined with other factors, such as socioeconomic data, to define shortage of veterinary care areas or care deserts.
Methods
The development of a complete measure of a veterinary care desert is a complex challenge that, in part, will be dependent upon how a care desert is defined. This research concerns itself with the specification of two spatially defined concepts that are classically included in the definition of service deserts in other industries. Two such examples include the United States Department of Agriculture Food Desert Research Atlas and the Health Professional Shortage Areas. Both these examples include two similar geographic factor specifications. The first is the ratio of care providers or facilities normalized by a population measure, and the second is the distance specification that characterizes the geographic scale at which the ratio applies.
Specifying these parameters is accomplished in this research using empirical data on an existing distribution and establishes benchmark values based on weighted means. The benchmarks are generated for three different measures of human and companion animal populations in each county in the contiguous United States. The three measures are the ratio of veterinary employees to the number of households, the ratio of veterinary employees to the predicted cat/dog population, and the ratio of veterinary employees to the predicted number of cat/dog-owning households. The benchmark is set at the weighted mean of each of the ratios across all counties in the contiguous United States. Although this does not identify what an optimally occurring parameter specification would be, it serves to provide a normative value that can be evaluated through future observation of clinical patterns to adjust parameter specification as indicated. The value of this approach is the relative ease of obtaining and analyzing a large volume of data that can specify parameters at a national level.
Veterinary care employee ratio
The ratio of veterinary clinic employees to some measure of the population is the first parameter specified. Duplicating the methodology advanced by Neal and Greenberg,8 the number of employees at each veterinary clinic located in the contiguous United States was identified and aggregated at the county level by accessing data last updated in 2022. The number of veterinary clinic employees was obtained by accessing the databases of Earth Science Research Institutes. The total number of clinic employees is used under the assumption that this is a more functionally accurate measure of overall clinic capacity than simply the number of licensed veterinarians at a given location. Additional support staff, such as veterinary technicians, veterinary assistants, and even front desk staff contribute to the number of clients that a given veterinary clinic is capable of serving.
The AVMA Pet Demographic Sourcebook from 2018 was used to estimate pet populations and the number of pet-owning households at the county level. The AVMA data are published at the state level and extrapolated to the county level following the same methodology found in Neal and Greenberg8 by assuming an equal distribution of pet populations and pet-owning households over each state. Extrapolating the data to the county level may introduce additional error, and so the data on veterinary employees were also aggregated and analyzed at the state level. This allows an additional set of parameters that may not be as geospecific but may reduce some of the sampling error. The number of households in each county was obtained using the most recent estimate of US Census for 2022.
A weighted mean was calculated to serve as the parameter specification based on the number of households, cat/dog-owning households, or predicted cat/dog population. The weighted mean was calculated for each ratio of veterinary clinic employees to the different measures of population. The weighted mean was calculated using the formula:
where x is the ratio of veterinary clinic employees to the population measure (households, number of cats/dogs, or number of households with cats/dogs) in the county and w is the population measure value in the county. The purpose of this step is to give extra weight in the calculation of the mean for the ratios in counties that have more people or animals and, thus, create a more ‘common’ measure of experience than a simple mean that would give equal weight. This shifts the focus from the individual county to the individual experience of the households, cats/dogs, or cat/dog-owning households across the United States.
The number of employees needed to reach the weighted mean was then calculated for any county or state that returned values below the weighted mean. The variation of each state or county variable from the weighted mean was then calculated to derive the variation of each state or county’s number of employees from the weighted mean. Counties or states below the weighted national mean were identified, and the number of employees needed to bring each geography to a minimum of the weighted mean was then calculated for each ratio type. This analysis was completed at both the county level and the state level.
Included in the descriptive analysis was also the weighted standard deviation. The weighted standard deviation was calculated on the values using the following formula:
where wi is the number of households, estimated cat/dog population or predicted number of pet-owning households in the i th county, N' is the total sum of the population measure over the entire set of counties and  is the weighted mean. The weighted standard deviation and weighted mean are reported for each of the three different ratios examined (Tables 1 and 2) to provide options for interpretation and future application of the parameters.
Distance to clinic
Understanding how far individuals drive to access veterinary care is an additional essential component in the development of a definition of a veterinary care desert. It is a necessary parameter in many methods of evaluating service distributions in geostatistics and is necessary for performing a number of different complex analyses often used to measure access to services in other fields. It also provides a reference point for the geographic catchment of any given clinic location, which can be useful for communities investigating the adequacy in the availability of clinics and clinic staff in their location.
Data on the distance between client location and veterinary clinic were obtained through a partnership with VetSuccess. VetSuccess is a business intelligence and data analytics tool for veterinary clinics (see https://vetsuccess.com). It integrates with veterinary practice management systems, extracting and standardizing data. VetSuccess integrates with 16 veterinary practice management systems, including all of the most commonly used systems. Although not used by all veterinary clinics, it is integrated with approximately 5,000 veterinary clinics across the United States. The data represent clients active during a 12-month period from April 2021 to April 2022. Locations where very few clinics were available to protect privacy were eliminated from the data.
Travel distances were estimated by measuring the Euclidean distance between the centroids of the zip code polygons for the veterinary clinic and each of the respective clinic clients. Clients residing in the same zip code as that of the clinic, thus, returned a value of zero. Since zero values do not represent the real experience of the clients, the distance of travel of these clients was estimated by conceptualizing the zip code as a circle. The square mile area of the zip codes was extracted from the US census data using the Zip Code Tabulating Area (ZCTA) and accessed through ArcGIS online. Radii of these circles were then calculated according to the formula:

Travel distance within the zip code was then estimated as  , where r is the radius.
The distances were summarized in two different ways. The first way was a simple aggregate of the distances traveled presented in a histogram. Distances that clients travel, however, may vary with the driving conditions, which can be conceptualized by the population density and commuting patterns. For example, rural, low-density communities with high outward commuting flows may likely be willing to travel further physical distances than high-density urban areas where typical commuting patterns do not travel outside of the area. In order to account for these differences in willingness to travel, the data were also aggregated at different Rural Urban Commuting Areas (hereafter RUCA).
RUCA is a product of the US Census, whereby each census tract is categorized based on the following factors: degree of urbanization; population density; daily commuting patterns.9 RUCA has two levels of classification, primary and secondary, and both levels are used in this research by focusing on the primary and secondary classifications of the ZCTAs of the veterinary clients in the database. The RUCA classification schema relies on the definitions of metropolitan and micropolitan areas as ascribed by the Department of Management and Budget. Metropolitan areas, thus, are defined as areas with an urban core of at least 50,000 inhabitants, whereas micropolitan areas have an urban core of between 10,000 and 50,000 inhabitants.10 Small towns have clusters of a minimum of 5,000 inhabitants, and rural areas have clusters below this threshold or no clustering at all. The commuting flows evaluate commuting patterns within or outside of the area. Understanding commuting patterns can provide insight into typical travel within or outside of an area. For example, the so-called bedroom communities would have high outward commuting flows. This type of commuting pattern may then indicate that residents are accustomed to traveling further distances than an urban core with low levels of outward commuting flow.
Although the original RUCA was at the census tract level, an additional product was released in 2020 that assigns a RUCA at the zip code level through ZCTAs.9 ZCTAs are commonly used in geographic analysis because they approximate zip codes (which are simply a series of line routes established by the postal service) to polygon areas that can be mapped. The ZCTA-level RUCA is what was joined to the household data (zip code) in this research. The individual client’s distance to the clinic was then aggregated at each RUCA level.
Distribution of veterinary care providers
The total number of clinics found and entered into the analysis was 32,964. The clinic count was validated against the AVMA 2017 Report on the Market for Veterinary Services.4 According to the report, between 28,000 and 32,000 clinics were operating across the United States.4 The difference is likely due to the earlier vintage of the AVMA data. A total of 336,151 veterinary clinic employees were identified with a mean number of employees per clinic of 10.20, a median of 7, and a mode of 5. Some clinics with large number of staff were generally identified as veterinary teaching universities. Of the 3,108 (contiguous) US counties, 344 were found to have no veterinary clinics located within their boundaries. This means that over 1 million households, or an estimated 1.38 million companion animals, reside in counties with no veterinary clinics nearby. A total of 937 counties were found to have a deficiency of veterinary employees, where deficiency is defined as having less than the weighted mean of employees relative to the number of households when estimated at the county level.
The data are also reported at the state level for alternative parameter use. State-level data smooth variations in distribution and reduce the potential for error in the estimation of pet populations and numbers of pet-owning households.
The map in Figure 1 shows the deviation between the weighted mean of employees to households and the actual observed value in each county. Additional maps that visualize the data in alternative ways can be found at www.accesstovetcare.org.
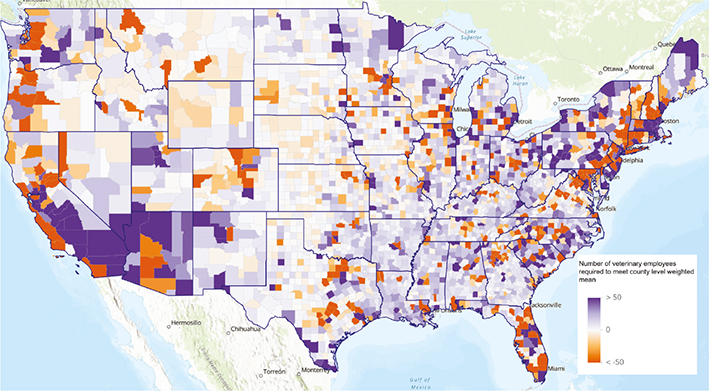
Figure 1. Number of clinic employees above or below the weighted mean at the county level when normalizing clinic employees by the raw count of households. See www.accesstovetcare.org for additional, interactive maps.
Figure 2 provides a summary of the ratios of care providers per 1,000 pet-owning households at the state level.
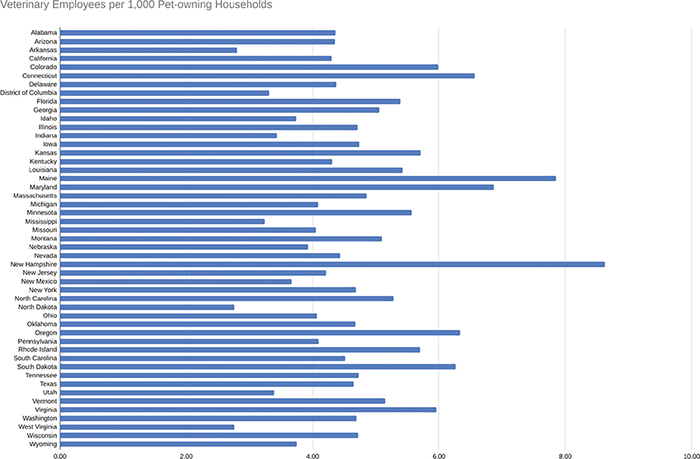
Figure 2. The ratio of veterinary clinic employees per 1,000 pet-owning households at the state level.
Driving distances
The data analyzed for this research represented a total of 10,488,461 client locations associated with a total of 3,723 veterinary clinics located within the contiguous United States. Distances driven are reported in aggregation first. A histogram representing the frequency of each driving distance is shown in Figure 3.
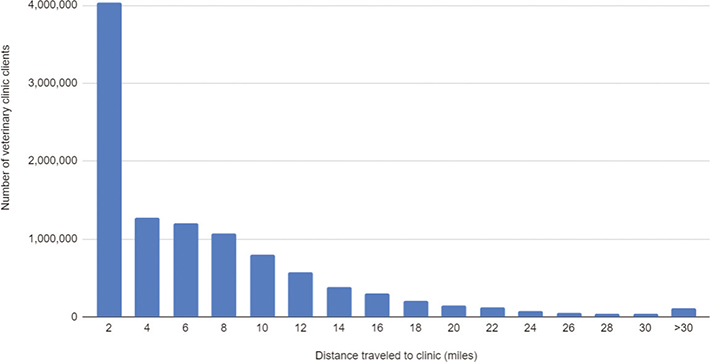
Figure 3. Histogram of distances between client residences and clinic locations.
The distances traveled to clinics were also aggregated by the RUCA score. Table 3 summarizes the results of this aggregation with mean distance between the client location zip and the clinic location zip at each of the represented categories. The table also displays the number of clients for which distance data were available at each of the categories and the definition of the RUCA type and subtype for which adequate data were available.
| RUCA | RUCA definition | Client count | Mean distance (miles) |
| 1 | Metropolitan area core: primary flow within an urbanized area (UA) | 7,494,834 | 4.18 |
| 1.1 | Secondary flow 30–50% to a larger UA | 227,508 | 4.87 |
| 2 | Metropolitan area high commuting: primary flow 30% or more to a UA | 1,053,737 | 7.08 |
| 2.1 | Secondary flow 30–50% to a larger UA | 29,198 | 7.81 |
| 3 | Metropolitan area low commuting: primary flow 10–30% to a UA | 65,542 | 8.60 |
| 4 | Micropolitan area core: primary flow within an urban cluster of 10,000–49,999 large UC | 750,706 | 4.93 |
| 4.1 | Secondary flow 30–50% to a UA | 80,799 | 7.45 |
| 5 | Micropolitan high commuting: primary flow 30% or more to a large UC | 187,212 | 9.82 |
| 5.1 | Secondary flow 30–50% to a UA | 4,993 | 8.68 |
| 6 | Micropolitan low commuting: primary flow 10–30% to a large UC | 28,513 | 9.46 |
| 7 | Small town core: primary flow within an urban cluster of 2,500–9,999 (small UC) | 255,941 | 7.87 |
| 7.1 | Secondary flow 30–50% to a UA | 27,751 | 6.60 |
| 7.2 | Secondary flow 30–50% to a large UC | 6,338 | 7.68 |
| 8 | Small town high commuting: primary flow 30% or more to a small UC | 53,833 | 10.21 |
| 8.1 | Secondary flow 30–50% to a UA | 388 | 10.73 |
| 8.2 | Secondary flow 30 to 50% to a large UC | 2,489 | 17.06 |
| 9 | Small town low commuting: primary flow 10–30% to a small UC | 19,824 | 10.07 |
| 10 | Rural areas: primary flow to a tract outside a UA or UC | 181,605 | 10.85 |
| 10.1 | Secondary flow 30–50% to a UA | 5,114 | 12.91 |
| 10.2 | Secondary flow 30–50% to a large UC | 6,475 | 11.96 |
| 10.3 | Secondary flow 30 to 50% to a small UC | 5,612 | 11.48 |
| 99 | Not coded: census tract has zero population and no rural–urban identifier information | 49 | 0.54 |
| UA = Urban Area; UC = Urban Cluster; RUCA = Rural Urban Commuting Areas. | |||
| RUCA code descriptions from https://www.ers.usda.gov/data-products/rural-urban-commuting-area-codes/. | |||
Discussion
The weighted mean of the number of employees and the distance to a clinic are basic ways of evaluating whether there are shortages in certain areas related to the available number of veterinary care employees. The results of the analyses of the ratios of clinic employees to the various measures of the population show that there is significant variation across space. Part of the challenge in this type of analysis is the difficulty in predicting pet populations or the number of pet-owning households. Although this remains a limitation, the use of state-level data does help to mitigate this as does the presentation of various options on how the ratios were calculated. The results of the state-level analysis and the alternative methods of normalizing the values all show considerable variations.
The number of employees needed to reach the weighted mean differs significantly when measured at the county level versus the state level. This likely speaks to the variation in distribution across space, where clinics are clustered in certain counties and are absent in others. Although on the surface, this may indicate a reduced need for care providers, the distances that individuals are from clinics indicate that people are generally not traveling long distances to reach clinics. Furthermore, the argument of cross-county travel to access care would predict that a lower ratio county would be surrounded by counties of higher ratios. Examining the map of employee deficiencies indicates this is not always the case, and that there are a number of examples of multiple contiguous counties with lower than mean levels of care providers.
It is also important to recognize that the number of employees needed to reach mean, as quantified in this work, refers to all clinic staff and not just veterinarians. The capacity of a clinic can fluctuate based on various factors: the number of support staff to the legal roles those support staff are allowed to engage in, the latitude given by the supervising veterinarian, the hours of operation, and the overall operational efficiency. For this reason, the number of staff alone represents just one way of estimating capacity for care. When looking at the number of staff needed to reach average, it is possible to further estimate the number of veterinarians needed by assuming some fixed ratio of veterinarians to staff. According to the American Animal Hospital Association (AAHA) 2019 Financial & Productivity Report, the average for the industry is approximately four full-time non-DVM staff for each Doctor of Veterinary Medicine (DVM).11
Individuals located in rural counties do drive further to access care than their urban equivalents. As would be expected, however, the sample size for rural resident experience is lower than that of urbanized, metropolitan areas. Although clients in rural and small towns are located physically further from the clinics, the actual drive time may not be functionally different due to traffic patterns in many urban areas. Patterns in distance between RUCA regions do appear to be well matched with the RUCA conceptualization of evaluating the commuting volumes within and outside of the UA/UC. The value for distance in RUCA code 8.2 seems to stand out from the other values. Category 8.2 represents small towns with moderate levels of outward commuting and may represent suburban areas with a mixture of those who do not commute out of the area and those who commute to an urban core. It is not immediately apparent why they would have anomalously large distances to veterinary clinics and may be a function of the smaller sample size for this subcategory. These measures are beneficial for future research to evaluate access to care as they indicate that catchments of veterinary clinics are larger in rural communities.
It is also important to note that the ratios and travel distances are empirical and do not provide a prescriptive threshold. The number of employees needed to reach mean values, for example, would allow for consistent access across space but not optimal access across space. Determining what a gold standard value would be is outside the scope of this research but is something future researchers could explore. Looking at certain geographies, such as the Northeast, and assessing the difference between other counties’ fall from those levels would be one option to address this question with the existing data. Furthermore, counties are an arbitrary choice of geography, and the density of the number of households, cat/dog populations, and cat/dog-owning households may vary considerably in a single county. The aim of this research, however, is to provide a benchmark and clinic catchment value that can be used as a starting point to evaluate veterinary care access at finer scales.
Limitations and future research
In addition to the limitations inherent in estimating pet populations and the number of pet-owning households, there are a few additional challenges. Distance calculations were done as simple Euclidean distances and as such do not take into account the functional driving distance. Additionally, they do not take into account the effect of traffic or travel modality. Additional impacts of further travel distances, such as ability to access a vehicle and cost of fuel, further compound access to veterinary care for individuals. Further exploration of how these parameters could be adjusted to provide options for these different limitations is an option for future research. The distance analysis also did not take into account the type of clinic that clients were accessing. An attempt was made to analyze the distance by basic type (emergency, general, and specialty), but there was some concern about how accurately the type of clinic was able to be defined, and so these results were excluded. Future research in this area could provide greater insight into catchments of clinics by clinic type.
Acknowledgments
The authors acknowledge the assistance and data sharing by VetSuccess for the distances that clients traveled to veterinary clinics. Specifically, the authors acknowledge Maria Gil-Rodriguez for her assistance in summarizing the distance data.
Author contributions
Sue M. Neal: conceptualization, analysis, writing – original draft. Mike J. Greenberg: conceptualization, analysis, visualization, writing – review and editing.
Data availability statement
The authors refer interested individuals to VetSuccess for the data referenced in the analysis of the drive times.
References
| 1. | LaVallee E, Mueller MK, McCobb E. A Systematic Review of the Literature Addressing Veterinary Care for Underserved Communities. J Appl Anim Welf Sci JAAWS. 2017;20(4): 381–394. doi: 10.1080/10888705.2017.1337515 |
| 2. | Access to Veterinary Care Coalition (AVCC) | Program for Pet Health Equity. 2018. Accessed June 29, 2021. https://pphe.utk.edu/access-to-veterinary-care-coalition-avcc/ |
| 3. | McConnell AR, Paige Lloyd E, Humphrey BT. We Are Family: Viewing Pets as Family Members Improves Wellbeing. Anthrozoös. 2019;32(4):459–470. doi: 10.1080/08927936.2019.1621516 |
| 4. | 2017-econ-rpt4-mkt-vet-services.pdf. Accessed January 5, 2022. https://www.avma.org/sites/default/files/resources/2017-econ-rpt4-mkt-vet-services.pdf |
| 5. | 20063121210.pdf. Accessed January 5, 2022. https://www.cabi.org/isc/FullTextPDF/2006/20063121210.pdf |
| 6. | Villarroel A, McDonald SR, Walker WL, Kaiser L, Dewell RD, Dewell GA. A Survey of Reasons Why Veterinarians Leave Rural Veterinary Practice in the United States. J Am Veterin Med Assoc. 2010;236(8):859–867. doi: 10.2460/javma.236.8.859 |
| 7. | 2012-pets-for-life-report.pdf. Accessed January 5, 2022. https://www.humanesociety.org/sites/default/files/docs/2012-pets-for-life-report.pdf |
| 8. | Neal SM, Greenberg MJ. Putting Access to Veterinary Care on the Map: A Veterinary Care Accessibility Index. Front Vet Sci. 2022;9:857644. doi: 10.3389/fvets.2022.857644 |
| 9. | USDA ERS – Rural-Urban Commuting Area Codes. Accessed May 25, 2022. https://www.ers.usda.gov/data-products/rural-urban-commuting-area-codes/ |
| 10. | 2020 Standards for Delineating Core Based Statistical Areas. Fed Regist. 2021. Accessed July 30, 2022. https://www.federalregister.gov/documents/2021/07/16/2021-15159/2020-standards-for-delineating-core-based-statistical-areas |
| 11. | American Animal Hospital Association, ed. Financial and Productivity Pulsepoints. 10th ed. Lakewood, CO: American Animal Hospital Association Press; 2019. |