ORIGINAL RESEARCH ARTICLE
Linked administrative records, adoption throughput, and early return of dogs after adoption in a rural animal shelter: a single-shelter retrospective study
Prayat Poudel* 
Associate Professor of Mathematics, Centre College, Danville, KY, USA
Abstract
Introduction: Rural, volunteer-intensive dog shelters commonly maintain linked administrative records, yet the utility of those records for daily adoption activity and early post-adoption returns remain unclear. Using records from one rural Kentucky dog shelter, this study characterizes adoption activity and early returns while assessing record completeness and limitations.
Methods: We used linked, de-identified dog records from one rural Kentucky shelter. ‘Placement’ is defined as coded adoption outcome in the event-history file; transfers, foster movements, and return-to-owner events are not counted as placements. The adoption archive covers June 2019 through April 2025 and includes 1,098 adoptions involving 1,017 dogs. For the operations analysis, we reconstructed a daily on-site dog census from the event-history file using a piecewise anchored series with the residual correction distributed linearly across days within each of 10 anchor-defined intervals (11 anchor reports). For the early-return analysis, we restricted the sample to first adoptions with a complete 7-day observation window. Given only 21 observed 7-day return events, we treat all return models as exploratory.
Results: Across 1,581 days in the operations window (490 placement days, 31.0%), higher start-of-day census was associated with greater odds of any placement (odds ratio [OR]: 2.52 per 10 additional dogs, 95% confidence interval [CI]: 1.66–3.84). Confirmed shelter-wide promotion days were associated with higher odds of any placement (OR: 3.30, 95% CI: 1.86–5.88). In the secondary Poisson rate model for placement counts, the point estimate on promotion days exceeded one (incidence rate ratio [IRR]: 1.14, 95% CI: 0.96–1.36), but the CI included 1, indicating no clear effect. In the return sample, 21 of 1,014 first adoptions ended in an observed return within 7 days (2.1%); the median time to observed return was 1 day (interquartile range [IQR]: 1–3), so the 7-day window predominantly captures acute placement breakdown. Discount-coded first adoptions had a higher 7-day return rate than non-discount-coded first adoptions (3.3% vs. 1.8%; adjusted OR: 1.98, 95% CI: 0.76–5.13). We interpret all associations descriptively and do not treat them as causal effects.
Conclusion: For this rural Kentucky shelter, the linked records are useful for tracking crowding-related adoption activity, but they support only limited descriptive conclusions about very-early return after adoption. Distinguishing shelter-wide promotions from adoption-level discounts is conceptually important. These two measures overlap partially, and the available records cannot distinguish selective fee waivers from blanket shelter-wide events. Stronger conclusions about placement stability would require clearer fee coding, more detailed return-reason fields, and basic adopter-context measures.
Keywords: animal sheltering; adoption return; population management; data quality; retrospective studies; companion animal welfare
Citation: Journal of Shelter Medicine and Community Animal Health 2026, 5: 177 - http://dx.doi.org/10.56771/jsmcah.v5.177
Copyright: © 2026 Prayat Poudel. This is an Open Access article distributed under the terms of the Creative Commons Attribution 4.0 International License (http://creativecommons.org/licenses/by/4.0/), allowing third parties to copy and redistribute the material in any medium or format and to remix, transform, and build upon the material for any purpose, even commercially, provided the original work is properly cited and states its license.
Received: 29 March 2026; Revised: 13 July 2026; Accepted: 13 July 2026; Published: 6 October 2026
Competing interests and funding: The author declares no potential conflicts of interest. This work was partially supported CentreWorks Mini-Grants.
Correspondence: *Prayat Poudel, 600 W Walnut St, Danville, KY 40422, USA. Email: prayat.poudel@centre.edu
Reviewers: Kevin Horecka, Paulo Afonso
Supplementary material: Supplementary material for this article can be accessed here.
Capacity-for-care models position shelter throughput – the rate at which dogs move into and out of available housing – as a primary determinant of population welfare, because crowding lengthens time in shelter and raises stress and disease load.1–4 Adoption is the most common positive exit from a shelter, and when an adoption breaks down within days, the dog cycles back into the same crowded environment under unfavorable conditions, so very-early return is operationally and welfare-relevant. Studies of return reasons consistently find that adopter expectations, household fit, and dog behavior, rather than easily recorded dog characteristics, drive most returns,5–9 and matching-oriented adoption programs may mitigate this risk.10
Administrative records are service-delivery data routinely collected for operational rather than research purposes,11 and they have been used in shelter settings to develop analytic tools for outcomes such as return to owner.12 However, relevant record fields are often sparse and inconsistently coded,13,14 particularly for return reasons and adopter context, and rural volunteer-intensive shelters remain understudied. In-kennel behavior predicts length of stay,15 but administrative archives rarely capture such behavioral measures. For a single shelter, then, a practical question is what the existing records can show about adoption throughput and very-early return, and where the records are too limited to support stronger claims.
We analyzed linked administrative records from one small rural Kentucky shelter spanning June 2019 through April 2025. We examined daily adoption activity in relation to start-of-day census and confirmed promotion windows and observed 7-day return after adoption. Because the study uses records from one volunteer-intensive shelter and includes a few observed returns, findings are presented as single-shelter descriptions rather than generalizable estimates.
Data and methods
Study design
We used linked, de-identified dog records from one small, volunteer-intensive animal shelter in rural Kentucky. The shelter is anonymized at the organization’s request, but the regional context is disclosed to help readers judge transferability.
Ethics statement
This study used only de-identified retrospective shelter records and involved no direct interaction with human participants or live animals. The shelter formally authorized the use of deidentified records; however, the shelter’s name has been kept anonymous. The study was classified as exempt by Centre College Institutional Review Board (IORG 0007063; FWA 00017871).
Data sources, study windows, and definition of placement
We use three de-identified data sources. The first is a historical adoption archive covering June 2019 through April 2025. The second is a dog event-history export that records intakes, outcomes, and foster movements over time. The third is a shelter-verified promotion-day calendar consisting of confirmed promotion windows supplied by the shelter.
Throughout, placement denotes adoption outcomes coded in the event-history file. Operationally, transfers, foster movements, and return-to-owners are not counted as placements in the operations analyses or in the headline placement counts. ‘Adoption throughput’ in this article therefore refers strictly to adoption outflow.
The shelter-operations analysis covers January 1, 2021, through April 30, 2025. We begin in January 2021 because day-level alignment between the archive and the event-history file is weaker earlier in the series, and because the earlier COVID-disrupted period is less attractive for operational inference.16,17 The early-return analysis is restricted to first adoptions with a complete 7-day observation window.
Daily on-site dog census
We reconstructed a daily on-site dog census from the event-history file. Intakes and foster returns add one dog, while outcomes and foster-out events subtract one; administrative service transactions that do not reflect a change in physical custody (dog-license purchase/renewal, microchip registrations, medical-care visits) are excluded from this tally. We then anchor this reconstructed series to 11 uploaded dog-only population reports spanning December 31, 2020, through April 30, 2025.
To align the raw event-history with observed anchor points, we applied a piecewise linear correction. Let ak and ak+1 denote successive anchor dates with observed counts Ak and Ak+1 and let Rt be the raw count on day t. For t in [ak, ak+1] the corrected count was defined as:

where Δk = Ak+1 – (Ak + Ra_{k+1} – Ra_k).
Thus, Ca_k = Ak and Ca_{k+1} = Ak+1 exactly, and the residual correction is distributed linearly in time across the intervals. Outside the first anchor, we applied a constant shift to align the early portion of the series with the first anchor. As a result, the reconstructed counts can be non-integer between anchors; but we retain them on the original (real-valued) scale for regression analyses to avoid introducing rounding artifacts.
Supplementary Table S1 and Supplementary Figure S2 document the interval corrections, raw and anchored paths, and observed anchor counts.
Because anchor counts are small in absolute terms (range: 3–31) and the residual corrections are non-trivial relative to those counts (range: −3 to +8) we report a raw-census sensitivity analysis (Supplementary Table S2).
Because the 11 anchors are sparse relative to the 1,581-day operations window, the reconstructed series between anchors reflects the cumulative daily balance of recorded intake, outcome, and foster events rather than a direct physical count. Small, ordinary timing differences in how individual events are logged relative to a dog’s actual transition can cause the interpolated series to run modestly above or below the two nearest anchors within a given interval. Supplementary Table S1 reports the size of this interval-level correction for each anchor pair, and the raw versus anchored sensitivity analysis (Supplementary Table S2) confirms the operations results are not sensitive to this choice of construction.
Promotion indicators and discount exposure
Promotion timing is used only in the shelter-operations analysis. The promotion calendar is drawn from shelter-verified confirmed promotion windows only; no web-added dates or discount-inferred dates are used. For each calendar date, we create indicators for whether any promotion was active and whether the promotion included free-fee or reduced-fee components.
In the early-return analysis, the primary exposure is adoption-level discount coding (actual_discount) rather than calendar-based promotion timing. That distinction matters because some discounted adoptions may reflect dog-specific fee decisions rather than shelter-wide promotions. Using adoption-level discount coding for the return analysis keeps the exposure definition cleaner. For the return analysis, adoption-level discount coding gives a more direct measure of whether the individual adoption was recorded as discounted.
Observed return outcomes and sparse household fields
The primary return outcome is whether a dog’s first recorded adoption is followed by an observed adoption-return intake within 7 days. This observed return measure omits private transfers, returns to another organization, or instability visible only after day 7.
Sample construction proceeded in two steps from the full adoption archive of 1,098 adoptions involving 1,017 dogs. Firstly, we excluded 26 adoptions whose 7-day observation window extended beyond the end of the event-history-data, leading 1,072 adoptions with complete 7-day follow-up. Secondly, we restricted this set to each dog’s first recorded adoption, to avoid non-independence from repeat adoptions of the same dog, yielding the final analytic sample of 1,014 first adoptions with complete follow-up. Three of the 1,017 dogs’ first adoptions fell in the excluded end-of-window period; the remaining 58 exclusions were repeat, non-first adoptions. Same-day returns are coded as day 0 and counted as observed returns within the 7-day window.
We also parse a small set of household-related variables from structured and semi-structured archive fields, including rent versus own, other pets, and rough yard or containment proxies. Because these variables are sparse and unevenly recorded, we treat them descriptively rather than using them as the basis for the main explanatory model.
Statistical approach
The shelter-operations analysis uses a two-part daily model. Firstly, we estimate whether a calendar day has any dog placement using logistic regression with start-of-day census (scaled per 10 dogs so coefficients reflect an operationally meaningful change), confirmed promotion timing, year-month effects, day-of-week effects, and a holiday indicator. Secondly, among days with at least one placement, we model the number of placements using a Poisson log-link working model with log (start-of-day census) as an offset and the same calendar controls.18 Heteroskedasticity-consistent (HC1) robust standard errors are used in both stages. We adopted a two-part rather than unified hurdle specification because the two questions are operationally distinct (whether a day produces any placement versus how many placements occur given activity),19,20 but we also reported a zero-truncated Poisson sensitivity fit on the positive count days (Supplementary Table S3) so the results can be compared directly with a model that formally accounts for the positive-count truncation.
The conditional count model’s offset assumes that placement counts scale proportionally with start-of-day census. We tested this assumption by refitting the second-state model with log (start-of-day census) as a free predictor. The estimated coefficient was 0.48 (95% confidence interval [CI]: 0.11–0.85; P = 0.006 against the null of one), indicating sub-proportional scaling. We retained the offset specification for its operational placement-rate interpretation but treat this assumption as a limitation. We assessed overdispersion and residual serial dependence. The Poisson model showed no substantial overdispersion; residual autocorrelation diagnostics suggested little short-range dependence, although longer-lag dependence could not be completely ruled out. These checks are reported in the supplement.
When the unit of analysis is a calendar day, adjacent days can be correlated for reasons the model does not see, a weekend event, a popular Facebook post, or simply the same dogs still waiting. The inclusion of year-month indicators, day-of-week effects, and a holiday term was intended to absorb the most salient recurring temporal structure. We additionally report formal Ljung-Box tests on Pearson residuals (Supplementary Table S4). For the first-stage logistic model, residual autocorrelation is not detectable at lag 7 (Q = 3.37, P = 0.848), lag 14 (Q = 12.16, P = 0.593), or lag 28 (Q = 25.83, P = 0.583). For the second-stage Poisson model, residual autocorrelation was borderline at lag 7 (Q = 13.33, P = 0.064) but statistically detectable at lag 14 (Q = 31.20, P = 0.005) and lag 28 (Q = 52.45, P = 0.003). We interpret the second-stage results conservatively in the light of this residual mid-range dependence. The reported HC1 robust standard errors partly accommodate this issue but do not fully remove the concern, so the second-stage point estimate should be read as secondary.
The early-return analysis is intentionally exploratory. With only 21 observed 7-day return events and three candidate predictors, the model has seven events per predictor, below common 10 EPV guidance.21 The adjusted model therefore includes only discount-coded adoption, age, and length of stay. Supplementary analyses report Firth-penalized, fuller dog-level, clustered all-adoption, year-stratified, repeat-return, and Kaplan–Meier checks.
Data cleaning was conducted in Python 3.13.9 and analysis in R 4.5.1. Limited language editing used Claude Haiku 4.5 (Anthropic) at proofreading level; no analytic content, statistical decisions, or conclusions were generated by the model, and the authors reviewed all output.
Results
Shelter operations: daily census, promotions, and placement flow
In the January 2021 through April 2025 operations window, there are 1,581 calendar days and 490 days with at least one recorded placement (31.0%). The shelter averaged 18.1 dogs on site at the start of the day (median 17), with higher mean census on placement days than on non-placement days (20.8 vs. 16.9).
Figure 1 plots monthly average census alongside monthly total placements. The two series generally move together, although not perfectly.
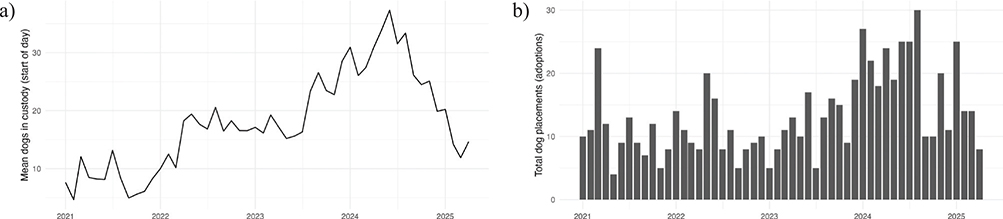
Fig. 1. Monthly on-site dog count and placement activity, January 2021 through April 2025. The two series move together but not identically. Monthly placements show a noisy baseline of roughly 5–15 per month through 2021–2023, with isolated spikes, followed by a sustained higher-volume period through 2024 in which most months recorded 15–30 placements; placements then decline toward baseline in early 2025.
Figure 2 shows the empirical probability that a day includes at least one placement after grouping days by start-of-day census. The probability of any placement rises as available on-site inventory increases.
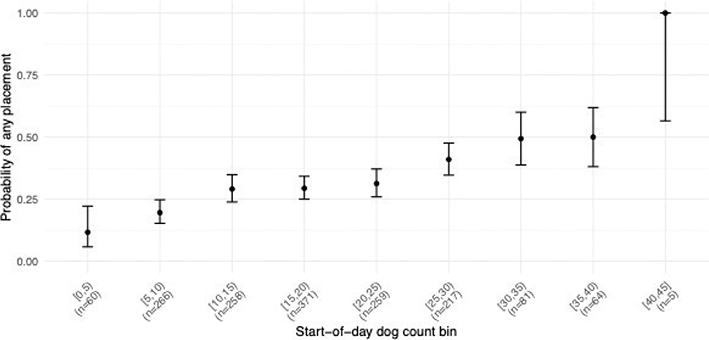
Fig. 2. Probability that a day has at least one placement, grouped by start-of-day dog count. Each point shows the mean probability of at least one placement within a start-of-day census bin; vertical bars show 95% Wilson confidence intervals.
Supplementary Table S10 summarizes placement-day activity by promotion grouping. In the first-stage model (Table 1), each additional 10 dogs in custody was associated with about two-and-a-half times the odds that a day includes at least one placement (odds ratio [OR]: 2.52, 95% CI: 1.66–3.84). Confirmed shelter-wide promotion days were also associated with substantially higher odds of any placement (OR: 3.30, 95% CI: 1.86–5.88). In the second-stage model (Table 2), the promotion-day point estimate exceeded one, but the interval included no effect (IRR: 1.14, 95% CI: 0.96–1.36).
Confirmed promotion windows also line up with actual discount use in the archive. Among placement days, confirmed promotion dates have a much higher same-day discount share than non-promotion dates (79.4% vs. 19.6%; Supplementary Table S12). The alignment is incomplete. Many discount-coded adoptions occurred outside confirmed promotion windows, and many promotion-day adoptions were not coded as discounted (Supplementary Table S13). Calendar-based promotion timing and adoption-level discount coding are therefore related, but they measure different things. For that reason, we treat them separately in the operations (promotion timing) and return (discount coding) analyses.
Sensitivity checks excluding January-March 2021 and using raw instead of anchored census were substantively unchanged (Supplementary Tables S2 and S15).
Early-return risk after first adoption
The main 7-day return sample contains 21 observed return intakes among 1,014 first adoptions (2.1%). Rates are directly comparable because all adoptions in the sample have complete 7-day follow-up.
The clearest descriptive pattern is how quickly these returns occurred. Among the 21 observed returns, the median time from adoption to return intake was 1 day; 11 of 21 returns (52%) occurred within 1 day, and 17 of 21 (81%) within 3 days. A Kaplan-Meier comparison showed 7-day survival of 98.2% for non-discount-coded first adoptions versus 96.7% for discount-coded adoptions (log-rank chi-square = 1.93, P = 0.16). The 7-day window therefore appears to capture mostly acute placement breakdowns, rather than the gradual post-adoption difficulties measured in longer follow-up studies.8,9 We therefore interpret the 7-day return outcome as a signal of immediate post-adoption mismatch (wrong-dog placement, severe behavior incompatibility, impulse-adoption regret) rather than as a general measure of post-adoption stability.
Table 3 gives the descriptive comparison by adoption-level discount coding. Discount-coded first adoptions had a 7-day observed return rate of 3.3%, compared with 1.8% for non-discount-coded first adoptions (Fisher’s exact P = 0.177). Figure 3 presents the same sample by age group and by days to observed return.
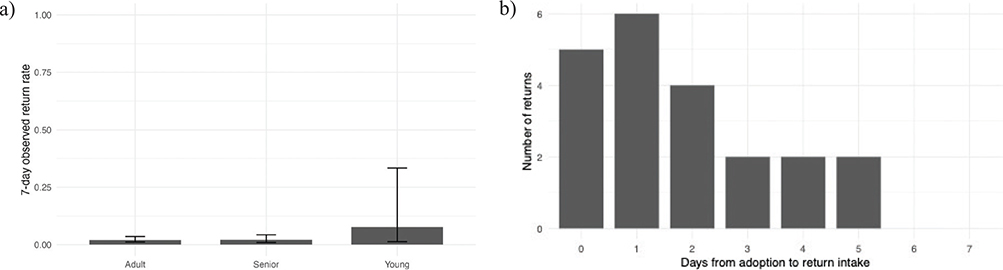
Fig. 3. Descriptive views of the first-adoption 7-day return sample (N = 1,014; 21 observed returns). (a) 7-day observed return rates by age group, with 95% Wilson confidence intervals. The intervals are wide because only 21 returns were observed, so these differences should be interpreted cautiously. (b) number of returned animals by days from adoption to return intake among the 21 observed returns. Most returns occurred very soon after adoption, with the largest concentration in the first few days; the median time to return was 1 day (IQR: 1–3 days).
Table 4 reports the main exploratory adjusted return model. Discount-coded adoption remains above one (OR: 1.98, 95% CI: 0.76–5.13), but the interval is wide. A Firth’s penalized sensitivity fit22 yields very similar estimates (discount-coded OR: 2.03, 95% CI: 0.76–5.01; Supplementary Table S5), suggesting that the rare-event correction does not change the inferential conclusion. We do not interpret either result as causal because selection of dogs into discount coding, including longer-stay or behaviorally challenging dogs, cannot be ruled out.
What the records still cannot explain well
The return analysis is limited by sample size and measurement. Free-text fields were sparse and could not support reliable adjusted modeling. The event-history file identifies the return date, but not consistently why a placement failed or how adopter expectations, household fit, or behavior history contributed. Table 5 lists a small set of structured fields that would make future return-risk modeling substantially more informative.
Discussion
This study estimates placement activity and shows that routine shelter data are better suited to some welfare questions than others. On the operations side, the pattern is straightforward: higher start-of-day census and confirmed promotion windows are associated with greater daily placement activity. At this rural Kentucky shelter, each additional 10 dogs on site was associated with roughly two and a half times the model-implied odds that a day produces at least one adoption, while confirmed promotion days were associated with roughly three-fold higher odds of a placement day, independent of census. These associations remain even after accounting for the number of dogs available for adoption and regular calendar patterns. As with all associations reported in this study, we do not interpret them as evidence that promotions or census level themselves cause placement activity to change.
This pattern is consistent with a capacity-for-care view of shelter operations.1,2,3,4 As census rises, crowding pressure increases and placements become the primary way to relieve that pressure. The second-stage model points in the same direction but is underpowered to detect a clear effect.
The throughput model treats all dogs in custody as exchangeable units of census, but in reality, a shelter population is a mix of high-throughput dogs, often puppies and small adult dogs, and low-throughput dogs, often large adult dogs with longer lengths of stay or behavioral concerns. Our test of the offset assumption shows that placement counts scale sub-proportionally with census: the free log-census coefficient is 0.48 (95% CI: 0.11–0.85, P = 0.006). In practical terms, the marginal placement rate per additional dog declines as census rises. This is what we would expect if staff capacity were relatively fixed and the shelter population includes some dogs who are harder to place. Prior work has also found that in-kennel behavior predicts individual dogs’ time to adoption, so throughput reflects dog-level factors beyond aggregate census and pricing.15 A higher census is therefore not simply ‘more dogs’: it may reflect more adoptable dogs, more hard-to-place dogs, more crowding pressure, or some mixture of these, and the archive does not let us separate these possibilities. Because the model cannot adjust well for this population mix, we treat the census-placement association as descriptive of aggregate crowding pressure rather than as a precise causal quantity.
The promotion/discount distinction is central. Shelter-wide promotions are organization-level events, whereas adoption-level discounts may include individualized fee waivers, sponsorships, long-stay incentives, or coding practices. Because these overlap incompletely, the records cannot isolate fee reductions from publicity or dog selection.
Prior fee-waived adoption studies provide useful context for this distinction. Studies of fee-waived or low-fee adoption programs have reported high adopter attachment, retention, and post-adoption care, and they do not support a simple interpretation that eliminating fees necessarily devalues the adopted animal.23–25 In this study, however, adoption-level discount coding may combine shelter-wide events with dog-specific fee waivers, sponsorships, long-stay incentives, and coding practices, so these prior findings provide context rather than a causal benchmark.
Very-early return is a welfare-relevant signal of placement instability because it marks a rapid breakdown in the placement and another abrupt transition for the dog. In these data, discount-coded first adoptions have a higher descriptive 7-day observed return rate than non-discount-coded first adoptions: 3.3% compared with 1.8%. The adjusted point estimate remains above one in the parsimonious model (OR: 1.98, 95% CI: 0.76–5.13), and the Firth’s penalized sensitivity analysis gives a nearly identical estimate (OR: 2.03, 95% CI: 0.76–5.01). However, the number of observed events is small, the CI is wide, and the available records do not contain enough consistent information on return reasons or adopter circumstances to support a strong explanatory model of early return.
The limited explanatory value of these return records is consistent with the shelter-adoption literature. Returns often reflect expectations, behavior, and household constraints, while follow-up studies show that a binary return outcome misses much of how placements actually unfold.5–9
A small number of documentation changes would substantially improve future analyses. Two record-keeping limitations particularly constrain analyses of this kind. The first concerns surrender-reason consistency. Ly and Protopopova13 document that shelter staff record surrender, or intake, reasons inconsistently, and the same concern applies to outcome reasons at adoption return. Standardized return-reason fields would make it easier to distinguish behavior-related returns from housing, financial, or expectation-related returns.
The second concerns discount coding. Clear separation of shelter-wide promotions from dog-specific fee waivers, sponsorships, and long-stay incentives at the time of recording would improve exposure measurement and would let shelters test exposure-specific hypotheses rather than aggregated ones. Beyond these two, more consistent recording of adopter context and support needs would strengthen future work aimed at reducing early instability and improving placement success. We do not test whether adopter-preparation tools reduce early returns here, but that question becomes much easier to study once return reasons and adopter context are recorded in a consistent way. Table 5 lists a small set of structured fields that would make future return-risk work substantially more informative.
Limitations
Several limitations should be kept in view. Firstly, this is a single shelter retrospective study at one small, rural, volunteer-intensive Kentucky shelter; estimates here should not be read as generalizable point estimates.
Secondly, promotion timing is observational rather than randomized. Promotion days may coincide with publicity, staffing changes, community events, or other operational shifts that are not measured here. Even though the promotion calendar is restricted to shelter-verified confirmed windows, the analysis cannot separate the effect of fee reductions from the effect of publicity or other contemporaneous operational changes.
Thirdly, the daily inventory series depends on the quality of the event-history path between anchor dates; we mitigate this with linear within-interval correction and report a raw versus anchored sensitivity.
Fourthly, the offset specification in the second-stage model is rejected by a within-sample test, reflecting population heterogeneity that we cannot adjust for with available fields.
Fifthly, residual day-to-day correlation in the second-stage residuals is statistically detectable at mid-range lags. HC1 robust standard errors partly accommodate this, but the estimate remains secondary.
Sixthly, the early return analysis is sharply underpowered: 21 observed events for three predictors places the models below the standard 10-EPV threshold. We did not apply Firth’s penalization in the main return model; a Firth’s penalized sensitivity gave near identical estimates, but the underlying inferential limitation is sample size, not penalization.
Finally, the data do not include in-kennel behavioral measures or return-reason coding, so we cannot adjust for or test the most plausible mechanisms behind throughput heterogeneity or early return.
Conclusion
At this rural Kentucky shelter, routinely collected administrative records were useful for monitoring adoption placement flow. Higher on-site census and confirmed promotion windows were associated with greater odds that a day included at least one placement. The conditional placement-rate estimate on promotion days was imprecise and secondary. Observed 7-day returns were uncommon, but when they occurred, they usually happened quickly, with a median return time of 1 day. Discount-coded first adoptions had a higher descriptive 7-day return rate than non-discount-coded adoptions, but the CI was wide, and the estimate is best treated as exploratory.
Shelters seeking to use routine records for welfare-focused decisions need clearer fee coding, standard return reasons, and basic household information before that question can be answered with confidence. In particular, future records should explicitly separate shelter-wide promotion events from individualized fee waivers and sponsorships, standardize return-reason coding, and include basic adopter-context fields. Until those fields are collected, the best use of linked shelter records is to monitor throughput, flag early post-adoption problems, and identify where additional support or documentation is needed, not to predict with confidence which adoptions will fail.
Author’s contributions
Single-author manuscript.
Acknowledgments
The author is grateful to Riley Fowler, Kaden Huiet, Sharon Mega, Sumit Sah, Pranjal Shrestha, and Jessie Straeder for their assistance with the project. The author would especially like to thank Kari Kuh for her time, thoughtful guidance, and support throughout this project. Her insight and encouragement were invaluable in shaping the questions and the direction of this article.
References
| 1. | Karsten CL, Wagner DC, Kass PH, Hurley KF. An Observational Study of the Relationship between Capacity for Care as an Animal Shelter Management Model and Cat Health, Adoption and Death in Three Animal Shelters. Vet J. 2017;227:15–22. doi: 10.1016/j.tvjl.2017.08.003 |
| 2. | Newbury S, Blinn MK, Bushby PA, et al. Guidelines for Standards of Care in Animal Shelters. 1st ed. Apex, NC: Association of Shelter Veterinarians; 2010. |
| 3. | Association of Shelter Veterinarians. Guidelines for Standards of Care in Animal Shelters: Second Edition. J Shelter Med Community Anim Health. 2022;1(suppl 1):1–76. |
| 4. | University of Wisconsin Shelter Medicine Program. Length of stay (LOS). Published 2025. Accessed Mar 30, 2026. https://sheltermedicine.wisc.edu/library/resources/length-of-stay-los |
| 5. | Shore ER. Returning a Recently Adopted Companion Animal: Adopters’ Reasons for and Reactions to the Failed Adoption Experience. J Appl Anim Welf Sci. 2005;8(3):187–198. https://doi.org/10.1207/s15327604jaws0803_3 |
| 6. | Hawes SM, Kerrigan JM, Hupe T, Morris KN. Factors Informing the Return of Adopted Dogs and Cats to an Animal Shelter. Animals. 2020;10(9):1573. doi: 10.3390/ani10091573 |
| 7. | Powell L, Lee B, Reinhard CL, et al. Returning a Shelter Dog: The Role of Owner Expectations and Dog Behavior. Animals. 2022;12(9):1053. doi: 10.3390/ani12091053 |
| 8. | Scott S, Jong E, McArthur M, Hazel SJ. Follow-Up Surveys of People Who Have Adopted Dogs and Cats from an Australian Shelter. Appl Anim Behav Sci. 2018;201:40–45. doi: 10.1016/j.applanim.2017.12.021 |
| 9. | Bohland KR, Lilly ML, Herron ME, Arruda AG, O’Quin JM. Shelter Dog Behavior after Adoption: Using the C-BARQ to Track Dog Behavior Changes through the First Six Months after Adoption. PLoS One. 2023;18(8):e0289356. doi: 10.1371/journal.pone.0289356 |
| 10. | Reese LA. Make Me A Match: Prevalence and Outcomes Associated with Matching Programs in Dog Adoptions. J Appl Anim Welf Sci. 2021;24(1):16–28. doi: 10.1080/10888705.2020.1867985 |
| 11. | Connelly R, Playford CJ, Gayle V, Dibben C. The Role of Administrative Data in the Big Data Revolution in Social Science Research. Soc Sci Res. 2016;59:1–12. doi: 10.1016/j.ssresearch.2016.04.015 |
| 12. | Kremer T. A New Web-Based Tool for RTO-Focused Animal Shelter Data Analysis. Front Vet Sci. 2021;8:669428. doi: 10.3389/fvets.2021.669428 |
| 13. | Ly LH, Protopopova A. A Mixed-Method Analysis of the Consistency of Intake Information Reported by Shelter Staff upon Owner Surrender of Dogs. J Appl Anim Welf Sci. 2023;28(2):259–280. doi: 10.1080/10888705.2023.2250254 |
| 14. | ASPCApro. What Animal Data Do You Need? Accessed Mar 30, 2026. https://www.aspcapro.org/resource/what-animal-data-do-you-need |
| 15. | Protopopova A, Mehrkam LR, Boggess MM, Wynne CDL. In-Kennel Behavior Predicts Length of Stay in Shelter Dogs. PLoS One. 2014;9(12):e114319. doi: 10.1371/journal.pone.0114319 |
| 16. | Applebaum JW, Peek CW, Zsembik BA. Trends in Intake and Outcome Data from U.S. Animal Shelters from 2016 to 2020. Front Vet Sci. 2022;9:863990. doi: 10.3389/fvets.2022.863990 |
| 17. | Powell L, Houlihan C, Stone M, et al. Animal Shelters’ Response to the COVID-19 Pandemic: A Pilot Survey of 14 Shelters in the Northeastern United States. Animals. 2021;11(9):2669. doi: 10.3390/ani11092669 |
| 18. | Cameron AC, Trivedi PK. Regression Analysis of Count Data. 2nd ed. Cambridge: Cambridge University Press; 2013. |
| 19. | Mullahy J. Specification and Testing of Some Modified Count Data Models. J Econom. 1986;33(3):341–365. doi: 10.1016/0304-4076(86)90002-3 |
| 20. | Zorn CJW. An Analytic and Experimental Examination of Zero-Inflated and Hurdle Poisson Specifications. Sociol Methods Res. 1998;26(3):368–400. doi: 10.1177/0049124198026003004 |
| 21. | Peduzzi P, Concato J, Kemper E, Holford TR, Feinstein AR. A Simulation Study of the Number of Events Per Variable in Logistic Regression Analysis. J Clin Epidemiol. 1996;49(12):1373–1379. doi: 10.1016/S0895-4356(96)00236-3. |
| 22. | Heinze G, Schemper M. A Solution to the Problem of Separation in Logistic Regression. Stat Med. 2002;21(16):2409–2419. doi: 10.1002/sim.1047 |
| 23. | Weiss E, Gramann S. A Comparison of Attachment Levels of Adopters of Cats: Fee-Based Adoptions Versus Free Adoptions. J Appl Anim Welf Sci. 2009;12(4):360–370. doi: 10.1080/10888700903163674 |
| 24. | MacArthur SL, Levy JK, Dingman PA, Tucker SJ. Outcome of Pets Adopted During a Waived-Fee Adoption Event: Maddie’s Matchmaker Adoptathon. In Maddie’s Shelter Medicine Conference proceedings, 2012. Gainesville, FL: Maddie’s Shelter Medicine Program, College of Veterinary Medicine, University of Florida; 2012. |
| 25. | ASPCApro. Research Shows Why Shelters Should Offer Free Cat Adoptions. ASPCApro. https://www.aspcapro.org/resource/research-shows-why-shelters-should-offer-free-cat-adoptions. Accessed May 17, 2026. |