ORIGINAL RESEARCH ARTICLE
Model Selection for Examining the Association Between Dog Intake Quantity and Socioeconomic and Geographic Conditions
Arisa Nishino* and Masaki Shimada
Graduate School of Science & Engineering, Teikyo University of Science, Yamanashi, Japan
Abstract
Introduction: Dog intake to government shelters reflects both community conditions and local animal management practices, yet predictors of intake in Japan have not been evaluated at a national scale. The objective of this study was to identify community-level socioeconomic and geographic predictors of dog intake to government shelters in Japan, stratified by intake type (owner-unknown vs. owner-relinquished) and administrative setting (urban vs. non-urban).
Methods: Publicly available municipal and prefectural data were used to model dog intake counts for 2022. Separate generalised linear models were developed for owner-unknown and owner-relinquished intake in urban areas (designated and core cities; n = 82) and non-urban areas (n = 47). Socioeconomic-related explanatory variables tested included the proportions of low-income households, older adults’ households, owner-occupied households, and individuals with higher education levels. Geographically related explanatory variables included the proportion of vacant houses, cultivated land area, the highest temperature, and the lowest temperature.
Results: Intake rates varied widely across regions. In urban areas, higher owner-unknown intake was associated with lower education level (incidence rate ratio [IRR] = 0.28, 85% confidence interval [CI]: 0.18–0.43) and higher cultivated land area (IRR = 1.34, 85% CI: 1.03–1.73). In non-urban areas, owner-unknown intake was higher in areas with more vacant housing (IRR = 14.64, 85% CI: 7.54–28.40), more cultivated land (IRR = 2.27, 85% CI: 1.58–3.25), and higher lowest temperature (IRR = 1.12, 85% CI: 1.04–1.20). Urban owner-relinquished intake was associated with owner-occupied housing (IRR = 1.64, 85% CI: 1.22–2.20). Non-urban owner-relinquished intake was higher in areas with a greater proportion of low-income households (IRR = 1.73, 85% CI: 1.03–2.89).
Conclusion: Supported predictors differed by intake type and administrative setting, suggesting that intake prevention strategies may be more effective when tailored to local context and dominant intake pathway. The associations observed in this study can serve as a basis for informing future policy development and further research.
Keywords: animal shelters; animal welfare; companion animals; stray animals; animal abandonment; animal rescue; animal control; animal relinquishment; canine; models
Citation: Journal of Shelter Medicine and Community Animal Health 2026, 5: 164 - http://dx.doi.org/10.56771/jsmcah.v5.164
Copyright: © 2026 Arisa Nishino and Masaki Shimada. This is an Open Access article distributed under the terms of the Creative Commons Attribution 4.0 International License (http://creativecommons.org/licenses/by/4.0/), allowing third parties to copy and redistribute the material in any medium or format and to remix, transform, and build upon the material for any purpose, even commercially, provided the original work is properly cited and states its license.
Received: 5 November 2025; Revised: 8 January 2026; Accepted: 19 January 2026; Published: 28 February 2026
Competing interests and funding: The authors did not receive support from any organisation for the submitted work.
Correspondence: *Arisa Nishino, Graduate School of Science & Engineering Teikyo University of Science, Yamanashi, Japan. Email: g23na002@st.ntu.ac.jp
Reviewers: Connor Sheehan, Ron Orchard
Supplementary material: All appendices are available in the supplementary material section here.
In Japan, both governmental and private animal organisations take in dogs. While private organisations are allowed autonomy in the animals they choose to take in, local governments are obliged to take in all dogs when owners cannot keep them, or ownership is unknown under the national1 Act on Welfare and Management of Animals (Act on Welfare of Animals) (Act No. 105 of 1973) and the2 Act on Rabies Prevention Law (Act No. 247 of 1950). Following intake, under the Act on Welfare of Animals, authorities are required to make efforts to locate and return animals that are presumed to have an owner. For animals that are presumed to be ownerless, those surrendered by their owners, or those whose owners cannot be located, authorities must solicit new owners. When neither is possible, dogs may be euthanised. The Act, however, does not specify how intake and other processes should be conducted, leading to possible discrepancies between local governments.
Japan has 47 prefectural governments, which are administrative divisions that serve as regional governance units. Governmental intake of dogs is handled at both the prefectural and city levels, which differ significantly in geography and demographics. In general, cities with over 200,000 people are granted certain administrative authority by the prefectural government to conduct animal management independently of the rest of the prefecture. Cities with over 200,000 people are termed ‘core cities’ and cities with over 500,000 people are termed ‘designated cities’, as determined by the Local Autonomy Act3 (Act No. 67 of 1947). There are 82 of these local city governments that handle dog intake separately from the rest of the prefecture in which they are located. The prefectural governments are responsible for the rest of the country, including cities of fewer than 200,000 people, rural areas, and depopulated areas. The Ministry of the Environment collates and makes publicly available the reported quantity of owner-relinquished and owner-unknown dog intakes from the designated cities, core cities, and prefectures. Previous research has indicated that multiple variables may affect the need for dog intake. For example, the presence of abandoned houses,4 agricultural land,4 and rural areas5 are associated with more stray or semi-feral dogs. In addition, socioeconomic conditions such as financial instability,6 owners’ age,3,6–9education,9,11 income,12–15 and housing7,10,12,16–18 may also influence dog ownership and relinquishment.
In this study, we investigate whether socioeconomic and geographic conditions are relevant to the number of dog intakes by analysing publicly available government data on intakes reported by 129 local governments across the country. This country-wide approach is novel, with the intent of generalisable results to Japan.
Methods
Variable sources and definitions
Core and designated cities were defined as ‘urban areas’, and prefectures as ‘non-urban areas’. All 129 local governments (82 core or designated cities, and 47 prefectures) were included to maximise generalisability. Owner-unknown dogs include stray, feral, and lost dogs whose owners cannot be identified and are either captured by officials or brought in by citizens. The intake values from 2022 were defined as the response variables.20 The intake numbers were divided into four conditions: (1) number of owner-unknown dog intakes (urban areas), (2) number of owner-unknown dog intakes (non-urban areas), (3) number of owner-relinquished dog intakes (urban areas), and (4) number of owner-relinquished dog intakes (non-urban areas). Hereafter, when referring to the number of owner-unknown dog intakes and the number of owner-relinquished dog intakes without specifying the area, we mean the total quantity of intakes from both areas. When using urban areas and non-urban areas, we refer to the number of intakes in each region.
An analysis was conducted using a method similar to that previously described.19 Socioeconomic and geographic habitat-related data for urban and non-urban areas were obtained from publicly available population census data on the e-Stat Portal Site of Official Statistics of Japan.21 Based on potential associations with dog intake as indicated by previous research, eight explanatory variables were selected as described in Table 1. All explanatory variables were selected a priori based on existing literature. Model selection was not used to identify new predictors.
| Explanatory variable | Definition of explanatory variable | Rationale | Data sources |
| Low-income households | We divided the sum of households with an annual income of 1 million yen or less and those between 1 and 2 million yen by the total number of households with an annual income from 1 million yen or less to 15 million yen or more published in the same source. | In 2018, the median individual disposable income was 2.48 million yen, and half of this amount, or 1.24 million yen, defined the poverty line.28 Since the survey aggregates the data in intervals of 1 million yen, we used the share of households with incomes below 2 million yen as an indicator of the proportion of low-income households. | Statistics Bureau29 |
| Older adults households | We divided the number of households consisting only of members aged 65 years or older by the number of households published in the same source. | As a characteristic of socioeconomic conditions in Japan, society often regards the population aged 65 and over as the older adult population.30 | Statistics Bureau31 |
| Owner-occupied households | We divided the number of owner-occupied housing by the number of households in the same source. | In condominiums, regulations usually restrict the types of animal residents can keep.32 Therefore, we included the proportion of owner-occupied households, because such regulations scarcely constrain it, in the explanatory variable. | Statistics Bureau33 |
| Individuals with higher education levels | We divided the combined number of university and graduate school graduates aged 15 years or older by the population aged 15 years or older published in the same source. | In fiscal year 2020, the progression rate to high school was 83.5%, and that to universities (undergraduate) and junior colleges was 58.6%.34 Given the high progression rate up to high school, we defined the share of individuals with a university or graduate degree as the proportion of individuals with higher education levels. | Statistics Bureau35 |
| Vacant houses | We divided the number of vacant houses by the total number of houses, regardless of whether occupied or not. | We defined the proportion of vacant houses as explanatory variable separately from the proportion of owner-occupied housing. | Statistics Bureau33 |
| Cultivated land area | We defined cultivated land area as paddy field area + upland field area (FY2021) and divided it by the total land area (FY2019). | Ministry of Agriculture, Forestry and Fisheries36 Statistics Bureau37 | |
| Highest temperature | We identified the highest temperature among the monthly averages of daily highest temperatures in 2019. | Statistics Bureau37 | |
| Lowest temperature | We identified the lowest temperature among the monthly averages of daily lowest temperatures in 2019. | Statistics Bureau37 |
We used four socioeconomic variables for all four dog intake conditions: proportions of low-income households, households inhabited by older adults, owner-occupied housing, and individuals with higher education levels. Two geographic variables were used for both urban and non-urban owner-unknown dog intake conditions: the proportion of vacant houses and the cultivated land area. Two additional geographic variables, the highest and lowest temperatures, were used to estimate the number of owner-unknown dog intakes in non-urban areas. Urban and non-urban dog intake counts were obtained independently from Ministry of the Environment reports as separately aggregated outcomes. Non-urban intake values were not calculated by subtracting urban counts from prefectural totals. Subtraction was applied only to selected socioeconomic explanatory variables to align them with administrative boundaries; no subtraction or arithmetic derivation was applied to the outcome variables. For interpretability, all proportion-based socioeconomic predictors were rescaled so that one model unit corresponds to a 10 percentage-point increase. As all data in this study were collected from public, anonymised sources online, University ethical approval was not needed.
Statistical methods
All analyses were conducted in the statistical software R version 4.5.0.22 Pairwise correlations among all explanatory variables were assessed using the cor function in R to check for multicollinearity (Appendix A). Because no correlation coefficients exceeded 0.70, no predictors were removed on this basis. We further assessed multicollinearity in the full model by calculating variance inflation factors (VIFs), and all the values were within acceptable limits (Appendix B). Using this full model, we applied the dredge function in the MuMIn package23 to generate a candidate set of models for model selection.
We conducted model selection by constructing generalised linear models, performing model averaging, and calculating 85% confidence intervals (CIs). In constructing the model, we assumed a negative binomial distribution to account for the overdispersion of the response variable. Prior to model construction, basic model diagnostics were performed to evaluate distributional assumptions. Overdispersion was assessed by comparing Poisson and negative binomial models, which supported the use of a negative binomial distribution. Zero-inflated alternatives were explored but were not adopted, as they did not improve model fit. Influential observations were examined but were retained when judged to reflect genuine regional variation. For model estimation, we used the glm.nb function included in the Modern Applied Statistics with S (MASS) package.24 Furthermore, all generalised linear models included regional human population size as an offset to statistically control for the regional effects of population, and did not include it as a fixed-effect predictor.
The model equation was as follows:
When multiple models fell within the range of ΔAIC (Akaike information criterion) < 2,25 we checked the frequency with which each explanatory variable appeared in the models, and we performed model averaging with the model.avg function on the basis of the AIC weights. Following Burnham and Anderson,25 Sutherland et al.,26 and Arnold,27 we aimed to ensure consistency between AIC-based model selection and parameter evaluation. After model averaging, we obtained model-averaged estimates for each predictor and computed their two-sided 85% CIs. Predictors whose 85% CIs did not include zero were considered supported by the data under the information-theoretic framework. This approach is justified because a ΔAIC of approximately 2 corresponds to a likelihood ratio χ2 of 2 on 1 degrees of freedom (p = 0.157), as shown by Sutherland et al.26; thus, using 85% CIs aligns parameter evaluation with AIC-based variable support. To improve accessibility for a broad readership, we also report two-sided 95% CIs for all model-averaged parameter estimates; these 95% CIs are provided in Appendices C–F for each model. Note that inference and variable support in the main text follow the information-theoretic framework (85% CIs) described above.
To visualise spatial patterns in dog intake rates, prefecture-level dog intake rates per 1,000 population for non-urban areas were mapped using the Map Chart feature in Microsoft Excel (Microsoft 365; Microsoft). Because designated and core cities are spatially small, maps for urban areas were not presented.
Results
Dog intake counts varied widely across regions, with generally low median values but a small number of much higher observations. This pattern was most pronounced in urban areas, where outcomes were typically near zero but included occasional high intake counts (owner-unknown median 31.5, max 392; owner-relinquished median 4, max 89). Non-urban areas tended to have higher intake counts overall (owner-unknown median 213, max 1,048; owner-relinquished median 32, max 198). These higher values were examined and retained because they were judged to reflect meaningful regional differences rather than reporting or data-entry error. Descriptive statistics for the outcomes, candidate explanatory variables, and the population offset for the urban (n = 82) and non-urban (n = 47) models are provided in Tables 2 and 3.
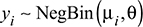
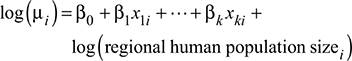
Non-urban dog intake rates per 1,000 population showed substantial geographic heterogeneity across Japan, with some prefectures experiencing considerably higher per capita intake than others. The spatial distribution also differed by intake type: prefectures with higher owner-unknown intake rates were not always the same as those with higher owner-relinquished intake rates, suggesting that the geographic patterning of stray/lost intake and owner relinquishment is not uniform (Figs. 1 and 2). Because designated and core cities are geographically small relative to prefectural boundaries, urban areas are not shown on the prefecture-level maps.
Fig. 1. Map of per capita owner-unknown dog intakes rate in non-urban areas. Darker shading represents higher intake rates.
Fig. 2. Map of per capita owner-relinquished dog intakes rate in non-urban areas. Darker shading represents higher intake rates.
Aim 1: number of owner-unknown dog intakes (urban areas)
Individuals with higher education levels had a significant negative association, and cultivated land area had a significant positive association with the number of owner-unknown dog intakes (urban areas) (Fig. 3). Six models fell within the range of ΔAIC < 2 (Appendix C). Individuals with higher education (β = -12.75; 85% CI [-16.95, -8.55]) and cultivated land area (β = 2.91; 85% CI [0.32, 5.49]) had 85% CIs that did not include zero. Specifically, areas with a 10–percentage-point greater proportion of cultivated land area exhibited an approximately 1.34-fold higher incidence rate of owner-unknown dog intakes (incidence rate ratio [IRR] = 1.34, 85% CI: 1.03–1.73). In contrast, areas with a 10–percentage-point higher proportion of individuals with higher education exhibited an approximately 0.28-fold incidence rate (i.e. substantially lower rates) of owner-unknown dog intakes (IRR = 0.28, 85% CI: 0.18–0.43).
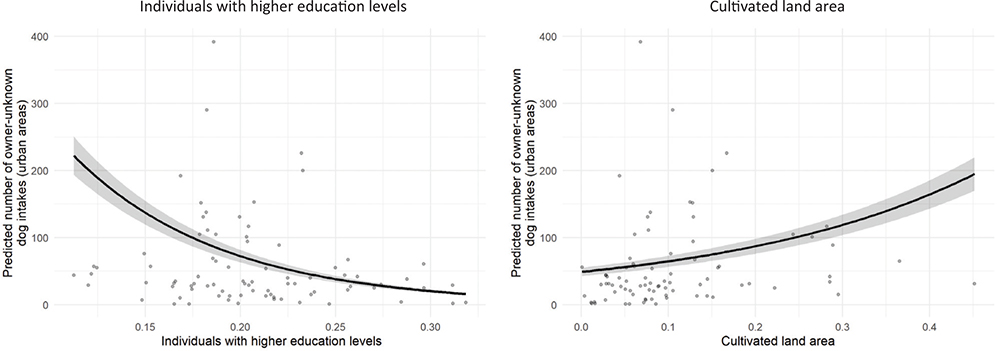
Fig. 3. Model-averaged predictions of number of owner-unknown dog intakes (urban areas). Left: This suggests fewer owner-unknown dogs may be found in areas with higher education levels. Right: This suggests more strays may be found in areas with high cultivated land. Black line: predicted values; grey area: 85% CI; dots: observed values. CI: confidence interval.
Aim 2: number of owner-unknown dog intakes (non-urban areas)
Vacant houses, cultivated land area, and lowest temperature had a significant positive association on number of owner-unknown dog intakes (non-urban areas) (Fig. 4). Seven models fell within the range of ΔAIC < 2 (Appendix D). Vacant houses (β = 26.83; 85% CI [20.21, 33.46]), cultivated land area (β = 8.19; 85% CI [4.59, 11.79]), and lowest temperature (β = 0.11; 85% CI [0.04, 0.18]) had 85% CIs that did not include zero. Specifically, areas with a 10–percentage-point higher proportion of vacant houses exhibited an approximately 14.64-fold higher incidence rate of owner-relinquished dog intakes (IRR = 14.64, 85% CI: 7.54–28.40). Areas with a 10–percentage-point greater proportion of cultivated land area showed an approximately 2.27-fold higher incidence rate (IRR = 2.27, 85% CI: 1.58–3.25). Lower temperature was associated with an approximately 1.12-fold higher incidence rate per 1°C increase (IRR = 1.12, 85% CI: 1.04–1.20).
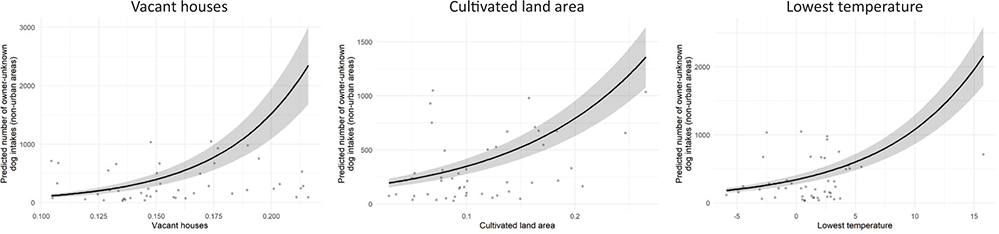
Fig. 4. Model-averaged predictions of number of owner-unknown dog intakes (non-urban areas). Left: This suggests more strays may be found in areas with more vacant houses. Middle: This suggests more strays may be found in areas with high cultivated land. Right: This suggests more strays may be found in areas with higher lowest temperatures. Black line: predicted values; grey area: 85% CI; dots: observed values. CI: confidence interval.
Aim 3: number of owner-relinquished dog intakes (urban areas)
Owner-occupied households had a significant positive association with the number of owner-relinquished dog intakes (urban areas) (Fig. 5). Four models fell within the range of ΔAIC < 2 (Appendix E). Owner-occupied households (β = 4.93; 85% CI [1.98, 7.88]) had 85% CIs that did not include zero. Specifically, areas with a 10–percentage-point higher proportion of owner-occupied households exhibited an approximately 1.64-fold higher incidence rate of owner-relinquished dog intakes (IRR = 1.64, 85% CI: 1.22–2.20).
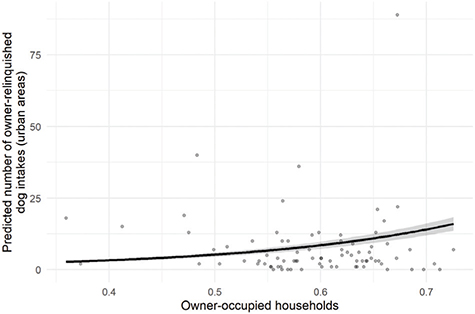
Fig. 5. Model-averaged predictions of number of owner-relinquished dog intakes (urban areas). This suggests more owner-relinquished dogs may be found in areas with higher proportions of owner-occupied households. Black line: predicted values; grey area: 85% CI; dots: observed values. CI: confidence interval.
Aim 4: number of owner-relinquished dog intakes (non-urban areas)
Low-income households had a significant positive association on number of owner-relinquished dog intakes (non-urban areas) (Fig. 6). Four models fell within the range of ΔAIC < 2 (Appendix F). Low-income households (β = 5.47; 85% CI [0.32, 10.62]) had 85% CIs that did not include zero. Specifically, areas with a 10–percentage-point higher proportion of low-income households exhibited an approximately 1.73-fold higher incidence rate of owner-relinquished dog intakes (IRR = 1.73, 85% CI: 1.03–2.89).
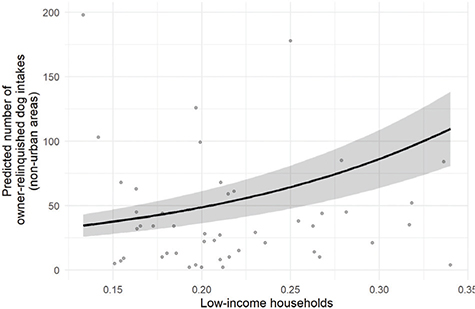
Fig. 6. Model-averaged predictions of number of owner-relinquished dog intakes (non-urban areas). This suggests more owner-relinquished dogs may be found in areas with higher proportions of low-income households. Black line: predicted values; grey area: 85% CI; dots: observed values. CI: confidence interval.
Discussion
We found associations between the number of owner-unknown dogs and owner-relinquished dogs taken into shelters in both urban and non-urban areas dependent upon geographic habitat and socioeconomic conditions, consistent with previous studies that report links between various socioeconomic conditions and the number of animal shelter intakes,50 the risk of pet abandonment,14,47 and cases of animal hoarding.6 The results differed between urban and non-urban areas, suggesting that in Japan, the factors influencing the number of dog intakes differ between urban and non-urban areas. This is not unique to Japan, as demographic and regional differences have been shown to affect animal shelter service in use in Canada and the United States (US) as well.47–49
Aim 1: number of owner-unknown dog intakes (urban areas)
The number of owner-unknown dog intakes (urban areas) had a significant negative association with individuals with higher education levels. As stated, owner unknown dog intakes may be from strays, lost, or abandoned dogs. One possible interpretation of this is that those with higher education are less likely to lose their dog or abandon them on the street if they can no longer keep them, and those without higher education are more likely. In a US-based study, New et al.9 also reported, ‘People relinquishing animals were significantly more likely not to have reached an educational level beyond high school’. In addition, Galarde-López et al.38 reported that improved access to spay/neuter services led to increased participation by responsible caregivers in both urban and rural areas. In Japan, however, the availability and amount of financial support for spay/neuter surgery vary across local governments.39 Given our finding of a significant negative association between owner-unknown dog intakes and the proportion of individuals with higher education, strengthening financial support for spay/neuter services in regions with lower educational levels may help reduce the number of owner-unknown dogs taken in by local governments.
Aim 2: number of owner-unknown dog intakes (non-urban areas)
The number of owner-unknown dog intakes (non-urban areas) had a significant positive association with vacant houses. Dănilă et al.4 reported in Romania that, ‘Stray / semi-feral dogs from the inner city and in rural areas occupy abandoned houses left in disrepair for various reasons’. We suggest that, in Japan as well, stray and semi-feral dogs may occupy abandoned houses for shelter leading to an increased presence of them in areas with vacant houses. The number of owner-unknown dog intakes (non-urban areas) also had a significant positive association with lowest temperature. Since a significant positive association with the lowest temperature indicates that regions with higher lowest temperatures have more of dog intakes, our results mirror the results of Uchikoshi40 who utilised the same data set from 10 years earlier and showed that, warmer regions tend to show a higher intake of animals per 10,000 people, while colder regions show a decrease (it should be noted, however, that Uchikoshi40 did not distinguish between owner-unknown and owner relinquished dog intakes).
For owner-unknown dog intakes in both urban and non-urban areas, we found that cultivated land area had a significant positive association on the number of intakes. Some support of his can be seen in other research. Dănilă et al.’s study4 of a rural area with primarily pasture with only a small portion of cultivated land surrounding a municipality in Romania found that stray roaming dogs were concentrated in the small, forested area. However, other concentrations were seen near household garbage pits and the agricultural land where small game was present. While having varied diets from scavenging, the stray dogs were shown to have a preference for meat.4 Pal41 who similarity studied stray dogs surrounding a town in West Bengal, India, found that the dogs main food source was scattered garbage but they were also supplemented by food waste from local restaurants and butchers. In Japan, the few areas with substantial litter also tend to have heavy foot traffic, making them less than ideal environments for stray dogs to safely secure food. Therefore, less populated areas such as cultivated land may be more enticing for unowned dogs.
In this study, we observed associations between several socioeconomic and geographical conditions and the number of owner-unknown dogs taken in by the government. de Santi et al.42 reported that, despite random capture efforts, the distribution graphs of captured dogs at 6-month intervals showed discernible spatial patterns, and that the areas surrounding the Americas District were among those with the highest densities of stray dogs. In Japan as well, specific regions with high numbers of stray dogs have been documented,43 and the intake figures for owner-unknown dogs in such areas include the capture of stray dogs.
Aim 3: number of owner-relinquished dog intakes (urban areas)
Number of owner-relinquished dog intakes (urban areas) had a significant positive association with owner-occupied households. According to Saunders et al.,44 a survey in California showed ‘the odds of owning a dog for a respondent who owned a home were 1.56 times the odds for a respondent who did not own a home’. In light of these findings, the authors suggest that Japan could have a similar situation and, areas that originally had a higher proportion of owner-occupied households have larger numbers of owned dogs, which likely increased the number of dogs relinquished by their owners.
Aim 4: number of owner-relinquished dog intakes (non-urban areas)
Number of owner-relinquished dog intakes (non-urban areas) also had a significant positive association with low-income households. Again in California, Dolan et al.13 found that ‘Among the 162 participants who responded, 115 (71%) stated either primarily or secondarily that cost (i.e. inability to pay for some care) was a factor in their decision’. In a review of over 46,000 owner-relinquished cats and dogs, it was shown that 86% of cases were because of human-related factors, as opposed to animal-related factors like bad behaviour.14 Owners’ socioeconomic conditions such as inadequate housing or financial problems are major contributors. McDowall et al14 reported that about 65.0% of relinquished dogs were from low socioeconomic homes with financial constraints specifically accounting for 11.2% of relinquishment reasons, ranking third in frequency. Furthermore, Crespo and Faytong-Haro45 suggest that the financial crisis led households to increase their ownership of pets in general, particularly dogs and cats. Based on these findings, the authors suggest that in regions of Japan with higher proportions of low-income households, pet relinquishment to government shelters is more frequent. In this study, we defined low-income households as the proportion of households earning ≤ ¥2,000,000, while Weiss et al.15 showed ‘Respondents with income ≤ $50,000 were more likely than others to re-home due to cost or housing’, indicating that the specific income levels associated with relinquishment may differ across countries.
Taken together, the supported predictors differed by intake type and administrative setting (urban vs. non-urban), suggesting that intake prevention strategies may be most effective when tailored to local context. For owner-unknown intake, geographic indicators such as vacant housing and cultivated land may help identify areas where free-ranging dogs are more likely to be present and where targeted prevention strategies (e.g. outreach, sterilisation support, and microchipping) could be prioritised. For owner-relinquished intake, socioeconomic indicators – particularly household income – may help identify communities where owners face greater constraints in maintaining pet ownership and where targeted support may reduce relinquishment.
At the same time, local governments in Japan are implementing measures to limit the number of dogs relinquished into shelters to reduce euthanasia. For example, they have introduced intake fees and refuse to accept dogs without a valid reason. However, the subsequent situation of dogs whose intake was refused remains unclear, raising concerns that dogs may be kept in poor conditions or are abandoned. Therefore, simply reducing the number of dogs owners relinquish to shelters is unlikely to fundamentally resolve animal welfare issues. Conversely, accepting all owner-relinquished dogs may burden shelters, which can also have negative consequences. According to the Basic Guidelines for Animal Welfare,43 prioritising reductions in euthanasia has been associated with challenges for ensuring both human and animal health and safety, including bite incidents following rehoming of animals with behavioural issues and overcrowding at recipient organisations. In addition, increases in intake may affect municipal shelter operations, euthanasia rates, and live-release rates, and may also contribute to overcrowding in private shelters that may need to accept surplus animals. Therefore, further investigation of nationwide intake-to-outcome ratios is warranted, including measures such as length of stay, rehoming rates, and euthanasia rates. Rodriguez et al.46 pointed out that understanding trends in intake at animal shelters is critically important for accurately assessing the overall capacity of the sheltering system and the resources available to address community-specific needs.
Limitations
Intake records were reported by individual municipalities, and reporting definitions and practices were not necessarily standardised, partially because prefectural and city governments operate under different management practices. Therefore, some observed urban–non-urban differences may partly reflect reporting variation rather than true differences in intake patterns. In addition, this was an ecological analysis using municipality-level predictors; associations should not be interpreted as causal or as applying to individual owners. Intake outcomes were measured for a single year, and some predictors were drawn from different administrative datasets and years, which may limit inference about temporal trends. Finally, unmeasured differences in local animal management practices (e.g. stray dog capture effort, shelter capacity, or intake restriction policies) may influence reported intake counts and could confound associations with community-level predictors.
Conclusion
This nationwide analysis found that community-level socioeconomic and geographic conditions were associated with dog intake to government shelters in Japan, and that supported predictors differed by intake type and by administrative setting (urban vs. non-urban). Owner-unknown intake was associated with education level and cultivated land in urban areas, and with vacant housing, cultivated land, and temperature in non-urban areas, while owner-relinquished intake was associated with owner-occupied housing in urban areas and the proportion of low-income households in non-urban areas. Together, these findings suggest that intake prevention efforts may benefit from being tailored to local conditions and to the predominant intake pathway (owner-unknown vs. owner-relinquished). Because local governments in Japan are implementing measures to limit relinquishment (e.g. intake fees and refusal without a valid reason), efforts to reduce intake should be evaluated alongside animal welfare and public safety outcomes and should be supported by improved monitoring of intake-to-outcome measures, including length of stay; rehoming (numbers rehomed to new owners or transferred to other private organizations); return-to-owner (numbers returned, with clarification of whether cases involve repeat returns by the same owner or separate cases involving different owners); and euthanasia (detailed circumstances leading to euthanasia).
Acknowledgements
We would like to thank Brittany C. Rapone (Oxford Brookes University, Oxford, UK) for helpful advice on improving the English of the manuscript.
Author contributions
All authors contributed to the study and approved the final manuscript.
References
| 1. | Act on Welfare and Management of Animals (Act No. 105 of Oct 1, 1973). e-Gov Law Search. 1973. Last amended June 7, 2023. https://laws.e-gov.go.jp/law/348AC1000000105. Accessed June 17, 2025. [in Japanese] |
| 2. | Act on Rabies Prevention (Act No. 247 of Aug 26, 1950). e-Gov Law Search. 1950. Last amended June 13, 2014. https://laws.e-gov.go.jp/law/325AC1000000247. Accessed November 5, 2025. [in Japanese] |
| 3. | Act on Local Autonomy (Act No. 67 of Apr 17, 1947). e-Gov Law Search. Published Apr 17, 1947. Last amended Jun 1, 2022. https://laws.e-gov.go.jp/law/322AC0000000067/20230901_505AC0000000014 Accessed November 5, 2025. [in Japanese] |
| 4. | Dănilă G, Simioniuc V, Duduman ML. Research on the ethology and diet of the stray dog population in the areas bordering the Municipality of Suceava, Romania. Vet Sci. 2023;10(3):188. doi: 10.3390/vetsci10030188 |
| 5. | Gill GS, Singh BB, Dhand NK, Aulakh RS, Ward MP, Brookes VJ. Stray dogs and public health: population estimation in Punjab, India. Vet Sci. 2022;9(2):75. doi: 10.3390/vetsci9020075 |
| 6. | Calvo P, Duarte C, Bowen J, Bulbena A, Fatjó J. Characteristics of 24 cases of animal hoarding in Spain. Anim Welf. 2014;23(2):199–208. doi: 10.7120/09627286.23.2.199 |
| 7. | Patronek GJ. Hoarding of animals: an under-recognized public health problem in a difficult-to-study population. Public Health Rep. 1999;114(1):81–87. doi: 10.1093/phr/114.1.81 |
| 8. | Hoarding of Animals Research Consortium (HARC). Health implications of animal hoarding. Health Soc Work. 2002;27(2):125–136. doi: 10.1093/hsw/27.2.125 |
| 9. | New JC, Salman MD, King M, Scarlett JM, Kass PH, Hutchison JM. Characteristics of shelter-relinquished animals and their owners compared with animals and their owners in U.S. pet-owning households. J Appl Anim Welf Sci. 2000;3(3):179–201. doi: 10.1207/S15327604JAWS0303_1 |
| 10. | New JC, Jr, Salman MD, Scarlett JM, et al. Moving: owners relinquishing dogs/cats to shelters. J Appl Anim Welf Sci. 1999;2(2):83–96. doi: 10.1207/S15327604JAWS0202_1 |
| 11. | Woodruff K, Smith DR, Cain C, Loftin C. The number of dogs entering shelters in five states, and factors that affect their outcomes: a study of the sheltering system. J Appl Anim Welf Sci. 2021;24(1):1–15. doi: 10.1080/10888705.2020.1852407 |
| 12. | Salman MD, New JG, Jr, Scarlett JM, Kass PH, Ruch-Gallie R, Hetts S. Human and animal factors related to relinquishment of dogs and cats in 12 selected animal shelters in the United States. J Appl Anim Welf Sci. 1998;1(3):207–226. doi: 10.1207/s15327604jaws0103_2 |
| 13. | Dolan E, Scotto J, Slater M, Weiss E. Risk factors for dog relinquishment to a Los Angeles Municipal Animal Shelter. Animals. 2015;5(4):1311–1328. doi: 10.3390/ani5040413 |
| 14. | McDowall S, Hazel SJ, Hamilton-Bruce MA, Stuckey R, Howell TJ. Association of socioeconomic status and reasons for companion animal relinquishment. Animals. 2024;14(17): 2549. doi: 10.3390/ani14172549 |
| 15. | Weiss E, Gramann S, Victor Spain C, Slater M. Goodbye to a good friend: an exploration of the re-homing of cats and dogs in the U.S. Open J Anim Sci. 2015;5(4):435–456. doi: 10.4236/ojas.2015.54046 |
| 16. | Graham T, Milaney K, Adams C, Rock M. ‘Pets negotiable’: how do the perspectives of landlords and property managers compare with those of younger tenants with dogs? Animals. 2018;8(3):32. doi: 10.3390/ani8030032 |
| 17. | Applebaum JW, Loney L, Horecka K, Graham TM. Housing-related companion animal relinquishment across 21 animal shelters in the United States from 2019–2023. Front Vet Sci. 2024;11:1430388. doi: 10.3389/fvets.2024.1430388 |
| 18. | Jensen JBH, Sandøe P, Nielsen SS. Owner-related reasons matter more than behavioural problems – a study of why owners relinquished dogs and cats to a Danish animal shelter from 1996 to 2017. Animals. 2020;10(6): 1064. doi: 10.3390/ani10061064 |
| 19. | Nishino A, Shimada M. Model selection for examining the association between cat intake quantity and socioeconomic conditions. Discov Anim. 2025;2(1):97. doi: 10.1007/s44338-025-00149-9 |
| 20. | Ministry of the Environment, Government of Japan. Statistics of Relinquished and Injured Dogs and Cats. 2023. https://www.env.go.jp/nature/dobutsu/aigo/2_data/statistics/files/r05/2_4_3a.pdf. Accessed November 13, 2024. [in Japanese] |
| 21. | Statistics Bureau of Japan. e-Stat (Portal Site of Official Statistics of Japan). 2023. https://www.e-stat.go.jp/. Accessed January 22, 2026. [In Japanese] |
| 22. | R Core Team. R: A Language and Environment for Statistical Computing. R Foundation for Statistical Computing; Vienna, Austria, 2025. |
| 23. | Bartoń K. MuMIn: Multi-Model Inference. 2010:1.48.11. doi: 10.32614/CRAN.package.MuMIn |
| 24. | Venables WN, Ripley BD. Modern Applied Statistics with S. 4th ed. Springer; dern Applied Statistics with S. 4th ed. New York, Springe, 2002. |
| 25. | Burnham KP, Anderson DR. Model Selection and Multimodel Inference: A Practical Information-Theoretic Approach. 2nd ed. Springer-Verlag; 2002. https://link.springer.com/book/10.1007/b97636. Accessed January 22, 2026. |
| 26. | Sutherland C, Hare D, Johnson PJ, Linden DW, Montgomery RA, Droge E. Practical advice on variable selection and reporting using Akaike information criterion. Proc R Soc B Biol Sci. 2023;290(2007):20231261. doi: 10.1098/rspb.2023.1261 |
| 27. | Arnold TW. Uninformative parameters and model selection using Akaike’s information criterion. J Wildl Manag. 2010;74(6):1175–1178. doi: 10.1111/j.1937-2817.2010.tb01236.x |
| 28. | Ministry of Health, Labour and Welfare. Overview of the 2022 Comprehensive Survey of Living Conditions. https://www.mhlw.go.jp/toukei/list/20-21kekka.html. Accessed June 17, 2025. [in Japanese] |
| 29. | Statistics Bureau of Japan. 2020 Population Census, Table 22–3: Number of Private Households by Family Type and Dwelling Tenure. e-Stat (Portal Site of Official Statistics of Japan). https://www.e-stat.go.jp/index.php/stat-search/database?page=1&layout=datalist&cycle=0&toukei=00200521&tstat=000001136464&tclass1=000001136466&statdisp_id=0003445169. Accessed January 22, 2026. [In Japanese] |
| 30. | Ministry of Health, Labour and Welfare. White Paper on Health and Welfare 2000. https://www.mhlw.go.jp/www1/wp/wp00_4/chapt-a1.html. Accessed June 18, 2025. [in Japanese] |
| 31. | Statistics Bureau of Japan. 2020 Population Census: Basic Tabulation. https://www.stat.go.jp/data/kokusei/2020/kekka.html. Accessed January 22, 2026. [In Japanese] |
| 32. | Ministry of the Environment, Government of Japan. Guidelines for Proper Keeping of Dogs and Cats in Dense Residential Areas. 2010. https://www.env.go.jp/nature/dobutsu/aigo/2_data/pamph/h2202.pdf. Accessed November 13, 2024. [in Japanese] |
| 33. | Statistics Bureau of Japan. 2018 Housing and Land Survey. https://www.stat.go.jp/data/jyutaku/2018/tyousake.html. Accessed June 17, 2025. [in Japanese] |
| 34. | Ministry of Education, Culture, Sports, Science and Technology. School Basic Survey FY2020. https://www.mext.go.jp/b_menu/toukei/chousa01/kihon/kekka/k_detail/1419591_00003.htm. Accessed June 18, 2025. [in Japanese] |
| 35. | Statistics Bureau of Japan. 2020 Population Census: Employment Status (Basic Tabulation). e-Stat (Portal Site of Official Statistics of Japan). https://www.e-stat.go.jp/stat-search/files?page=1&layout=datalist&toukei=00200521&tstat=000001136464&cycle=0&tclass1=000001136467. Accessed January 22, 2026. [In Japanese] |
| 36. | Ministry of Agriculture, Forestry and Fisheries. Crop Statistics Survey: Municipal Data, 2021 Production. https://www.e-stat.go.jp/stat-search/files?page=1&layout=datalist&toukei=00500215&tstat=000001013427. Accessed June 17, 2025. [in Japanese] |
| 37. | Statistics Bureau of Japan. Social and Population Statistics System. https://www.stat.go.jp/data/ssds/index.html. Accessed January 22, 2026. [In Japanese] |
| 38. | Galarde-López M, Rosales-Moreno EDR, Hernández-Méndez SE, et al. Spatiotemporal analysis of a population management intervention for dogs and cats in a municipality in central Mexico. Vet World. 2024;17:1693–1701. doi: 10.14202/vetworld.2024.1693-1701 |
| 39. | Ministry of the Environment, Government of Japan. Animal Welfare and Management Administrative Outline (FY2024 Edition): <III> Reference Material 3: Fees for Acceptance of Dogs and Cats and Subsidies for Neutering/Spaying. https://www.env.go.jp/nature/dobutsu/aigo/2_data/statistics/gyosei-jimu_r06.html. Accessed December 5, 2025. |
| 40. | Uchikoshi A. Public administration in the age of the pet boom. Seijo Law Rev. 2015;84:39–98. |
| 41. | Pal SK. Population ecology of free-ranging urban dogs in West Bengal, India. Acta Theriol (Warsz). 2001;46(1):69–78. doi: 10.1007/BF03192418 |
| 42. | De Santi CE, Chiba De Castro WA, Sibim AC, et al. Spatial distribution and population dynamics of free-roaming (stray and semi-domiciled) dogs in a major Brazilian city. Front Vet Sci. 2024;11:1417458. doi: 10.3389/fvets.2024.1417458 |
| 43. | Ministry of the Environment, Government of Japan. Basic Guidelines under the Act on Welfare and Management of Animals (Notification No. 53 of Apr 30, 2020). 2020. https://www.env.go.jp/nature/dobutsu/aigo/1_law/guideline.html. Accessed November 5, 2025. [in Japanese] |
| 44. | Saunders J, Parast L, Babey SH, Miles JV. Exploring the differences between pet and non-pet owners: implications for human-animal interaction research and policy. PLoS One. 2017;12(6):e0179494. doi: 10.1371/journal.pone.0179494 |
| 45. | Crespo P, Faytong-Haro M. Impact of the 2007–2008 United States economic crisis on pet ownership. Animals. 2022;12(21): 3010. doi: 10.3390/ani12213010 |
| 46. | Rodriguez JR, Davis J, Hill S, Wolf PJ, Hawes SM, Morris KN. Trends in intake and outcome data from U.S. animal shelters from 2016 to 2020. Front Vet Sci. 2022;9:863990. doi: 10.3389/fvets.2022.863990 |
| 47. | Ly LH, Gordon E, Protopopova A. Exploring the relationship between human social deprivation and animal surrender to shelters in British Columbia, Canada. Front Vet Sci. 2021;8:656597. doi: 10.3389/fvets.2021.656597 |
| 48. | Dyer JL, Milot L. Social vulnerability assessment of dog intake location data as a planning tool for community health program development: a case study in Athens-Clarke County, GA, 2014–2016. PLoS One. 2019;14(12):e0225282. doi: 10.1371/journal.pone.0225282 |
| 49. | Woodruff K, Smith DR. An estimate of the number of dogs in US shelters in 2015 and the factors affecting their fate. J Appl Anim Welf Sci. 2020;23(3):302–314. doi: 10.1080/10888705.2019.1663735 |
| 50. | Neal SM, Kremer T. Examining the relationship between social vulnerability and animal shelter intakes and outcomes: patterns and implications. Animals. 2024;14(22): 3166. doi: 10.3390/ani14223166 |