ORIGINAL RESEARCH ARTICLE
Post-Adoption Behavior and Adopter Satisfaction of Cats Across Socialization Likelihoods
Jacklyn J. Ellis*, Kyrsten J. Janke, Nicole M. Furgala and Taylor Bridge
Toronto Humane Society, 11 River St, ON M5A 1C7
Abstract
Introduction: Cats with questionable sociability are routinely adopted into typical home environments, but there has been no published investigation into the welfare of these cats in their adoptive homes or the quality of the adopter experience. The objective of this study was to assess differences in post-adoption behavior and well-being between cats based on their likelihood of being socialized, as well as differences in adopter experience.
Methods: This prospective behavioral study surveyed adopters of cats assessed via the Feline Spectrum Assessment (FSA) and a randomly sampled control group (those never suspected of being undersocial) of cats with intake and adoption dates during the same period. Adopters reported on behavioral traits, situational behaviors, and adopter satisfaction.
Results: As the likelihood of being undersocial increased, cats were more fearful, less affectionate, and less amenable to approach and petting (more so by strangers, but also by their owners). Adopters of FSA cats reported being slightly less satisfied than control cat adopters. As the likelihood of being undersocial increased adopters were less likely to report a traditional home environment as the best environment for their pet than control cats.
Conclusion: This study provides evidence that cats never suspected of being undersocialized experience better welfare than undersocial cats, and their adopters are more satisfied. These results are more pronounced for cats found more likely to be undersocial by the FSA. Although it is becoming increasingly possible to find adoptive homes for poorly socialized cats, it does not appear to be in the best interest of many of these cats or adopters. The results of the FSA may be helpful for making pathway decisions for each cat; evidence suggests that at least FSA 1&2 cats should be slated for Trap Neuter Return (TNR) or barn placement unless significant progress is made in shelter.
Keywords: feline; adoptability; human-animal bond; welfare; feral; behavior; Feline Spectrum Assessment; petting; approach; traits; shelter
Citation: Journal of Shelter Medicine and Community Animal Health 2025, 4: 116 - http://dx.doi.org/10.56771/jsmcah.v4.116
Copyright: © 2025. © 2025 Jacklyn J. Ellis et al. This is an Open Access article distributed under the terms of the Creative Commons Attribution 4.0 International License (http://creativecommons.org/licenses/by/4.0/), allowing third parties to copy and redistribute the material in any medium or format and to remix, transform, and build upon the material for any purpose, even commercially, provided the original work is properly cited and states its license.
Received: 27 September 2024; Revised: 16 December 2024; Accepted: 17 December 2024; Published: 17 February 2025
Competing interests and funding: The Canada Summer Jobs program provided funding to employ the research assistant during data collection. The authors declare no potential conflicts of interest.
Correspondence: *Jacklyn J. Ellis, 11 River St, Toronto, ON M5A 1C7, Canada. Email: jellis@torontohumanesociety.com
Reviewers: Brianna Lovell Myers, Peter Wolf
Supplementary material: Supplementary material for this article can be accessed here.
The most appropriate management strategy to ensure the quality of life of a cat entering a shelter environment varies based on many factors. Perhaps the most important of these is the cat’s level of socialization to people. Some people support attempting to socialize and adopt out all cats, because outdoor, unowned cats typically have shorter lives1 and face survival challenges2,3 not experienced by owned indoor cats. Others argue that socialization and adoption are not in the best interests of adult cats that are poorly socialized, as these cats typically experience poor welfare in shelter or traditional home environments4, and that these efforts should be reserved for cats that are closer to the socialized end of the spectrum.a
Since cats are generally prone to exhibiting fearful behaviors in a shelter environment, it can be difficult to identify how socialized a shelter cat is toward people – especially if there is little information available about their socialization history. The Feline Spectrum Assessment (FSA) was developed to make these assessments less subjective.5–8 It consists of 4 mini-tests conducted at 4 times over 2–3 days and results in a rating of how likely the cat is to be socialized to people. This test is being used increasingly in shelters.
Socialization exists on a spectrum: no experience with humans on one end and a lap-cat on the other.9 While increasing exposure to people paired with positive associations can help cats become more socialized,10 it is unlikely that the ‘more socialized’ version of a previously unsocialized cat will become as well suited for life in a shelter or home environment as a socialized cat8 (e.g. they may become reasonably comfortable in the presence of a person who is immobile and not paying attention to them but still cannot be touched or approached without experiencing fear). This is particularly true for older cats, outside of the socialization phase.11 For unsocialized or undersocialized (sometimes referred to as semi-socialized or ‘inbetweener’ cats) adult cats, best practices dictate that pathways such as trap neuter return (TNR) or alternative placement are more appropriate for their quality of life.4,12,13 But even the FSA does not give prescriptive guidelines about how likely to be socialized a cat must be for adoption to be considered an appropriate pathway.
This has led to the adoption of cats with questionable sociability into typical home environments. To date, there has been no research following up to investigate the behavior and well-being of poorly socialized cats in their subsequent adoptive home. Furthermore, although people may be willing to adopt poorly socialized cats, there is no data available on their experience or satisfaction with the placements. This study aimed to assess differences in post-adoption behavior and well-being between cats based on their likelihood of being socialized, as well as differences in adopter experience.
Methods
This prospective behavioral study surveyed adopters of all shelter cats who were assessed via the American Society for the Prevention of Cruelty to Animals (ASPCA’s) FSA conducted at Toronto Humane Society (THS) between October 15, 2018 and May 24, 2021 and were adopted between March 23, 2019 and February 28, 2022. All cats met the eligibility guidelines set out by the FSA manual: ≥6 months old, appear to be in good health (although chronic health conditions that would not affect their normal behavior did not disqualify them), not visibly pregnant/nursing/in heat, or obviously social. Cats received an FSA by a member of the training team after intake if they were suspected to be unsocialized. Cats were suspected to be unsocialized if they were noted as fearful in shelter, had not yet shown signs of enjoying petting (Response to Petting score ≤ 214), and there was no indication that the cat enjoyed human interaction before coming into the shelter (e.g. on an intake form or from a video). Records of cats that received an FSA and were ultimately adopted were retrieved from the shelter database (Petpoint 6 Data Management System). Cats were excluded if they had been in the adoptive home for less than 1 month, to allow for habituation to the new environment.
All cats that were categorized as ‘Extremely unlikely to be socialized’ or ‘Unlikely to be socialized’ by the FSA were identified for alternative placement in an environment such as a barn (provided they also met the medical and life history requirements to be included in THS’s Alternative Placement program). While looking for an appropriate alternative placement, cats were housed in out-of-cage spaces (with social companions where possible/appropriate) and received daily behavioral modification sessions consisting of desensitization and counter-conditioning to human approach/touch. If cats progressed to the degree that good welfare in a traditional home environment was deemed reasonable (e.g. emerge from hiding in front of people, enjoy petting, enjoy play), they were made available for adoption.
A control group of presumably socialized cats were selected through random sampling of cats between 6 months and 7 years old that had intake and adoption dates during the same period. Cats were excluded if they received an FSA or a veterinarian or the training team deemed them to be undersocialized, even in the absence of an FSA being performed.
A survey was created to investigate the prevalence of various behavioral traits in adopted cats, how these cats respond to situational social-directed behavior by either their adopter or a stranger, and owner satisfaction (Supplementary Material). The survey was pre-tested and revised to ensure the quality and efficacy of each survey question.15,16 Each question included an ‘I don’t know’ option, with the exclusion of Q1 (Do you still have this cat?).
Adopter contact was attempted up to three times, twice by telephone at different times of day and lastly by email. In hopes of increasing response rate, adopters were sent a study notification email,17,18 which included information about the study as well as notification that respondents would be included in a prize draw.19–23 Participation in the survey was voluntary and consent for use of the results in the study was ensured.
Differences in behavior traits in the adoptive home between FSA levels, including the control, were determined using ordinal logistic regression using Modern Applied Statistics with S (MASS) in R (R Statistical Software version 4.2.0). The traits surveyed and assessed included: fearfulness, playfulness, activity, aggression, affection, vocalness, and house soiling. Regression models were built to reduce residual deviance. In order to assess whether any FSA categories could be combined for analysis to help with small sample sizes, data was run raw, and binned. Data were run with and without controls to elucidate whether statistical significance was due to controls or FSA groups. The control group remained in its own bin while FSA groups were binned as FSA 4&5 (Socialized and Extremely likely to be socialized), FSA 3 (Likely to be socialized), and FSA 1&2 (Unlikely to be socialized and Extremely unlikely to be socialized). Traits that were significant were further analyzed using a Fisher’s Exact Test (XLSTAT, Data Analysis and Statistical Solution for Microsoft Excel, Addinsoft, Paris, France 2017). Subsequent survey questions were analyzed by Fisher’s Exact Test using these same socialization bins.
Results
Within the study period 81 cats received an FSA. Of these, 16 were excluded (12 = barn placed, 4 = euthanized), and 65 were surveyed with a response rate of 88% (57/65). Within the study period, 1,462 potential control cats were admitted. A random sample of 200 was surveyed with a response rate of 78% (155/200; Table 1). Three owners completed the survey but no longer had the cat in question, two owned FSA cats (one FSA 1&2 cat was ‘Let outside’ and one FSA 3 cat was ‘Rehomed’) and one owned a control cat (‘Rehomed’).
Of the seven traits assessed, an ordinal logistic regression analysis found fearfulness and affection were significantly associated with increasing socialization as described by the FSA groups and control (Table 2). A Fisher’s exact test stratified by FSA score revealed that FSA cats as a whole demonstrated lower affection and greater fearfulness than control cats, but that increasing FSA scores were associated with lower levels of fearfulness while affection was not noticeably different between FSA levels (Fig. 1). FSA 1&2 cats had greater odds of being fearful cats (Likert score 4 for fearfulness) and lower odds of being nonfearful cats (Likert score 1 for fearfulness) than FSA 3, 4&5, and control cats. FSA 3 cats had greater odds of being moderately fearful cats (score 3).
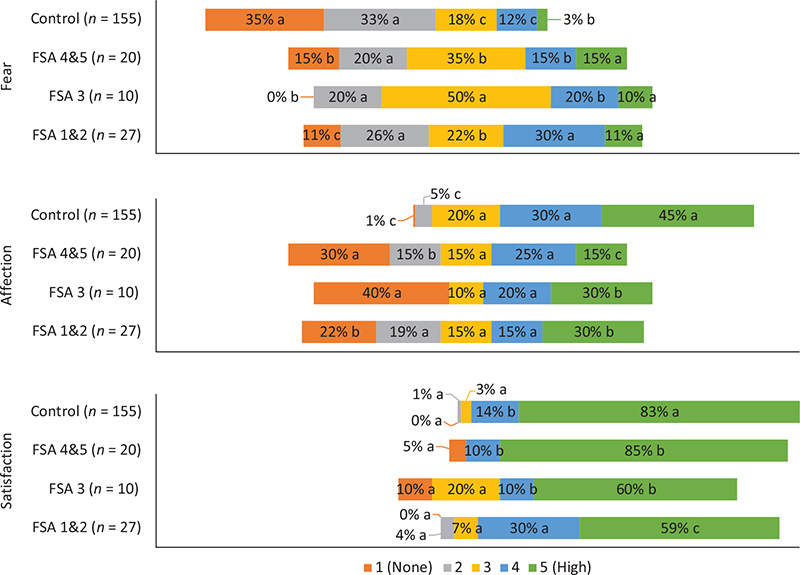
Fig. 1. The reported degree of fearfulness (1–5 on a Likert scale) and affection (1–5 on a Likert scale) in shelter cats post-adoption and adopter satisfaction (1–5 on a Likert scale) stratified by how likely to be socialized they were found to be by the FSA with control (presumably socialized) cats included. FSA 1&2 = Extremely unlikely and Unlikely to be socialized; FSA 3 = Likely to be socialized; FSA 4&5 = Extremely likely and Likely to be socialized; Control = cats never suspected of being undersocialized (and therefore, presumably socialized). Analyses were run on raw data, but percentages are presented in this table to improve interpretability (due to difference in sample sizes). Significance testing is within Likert response levels, between study groups. Values with different superscript levels are significantly different (Fisher’s exact test; α = 0.05). Graphs are centered on the middle Likert category (3).
Aggression, house soiling, and fearfulness were the traits adopters of both FSA and control cats most often reported as problematic when present (Fig. 2). Of these three traits, the only one that had a significant difference between FSA groups and the control was fearfulness, but the sample size was too small to determine whether adopters reported a difference in how problematic the trait was between FSA groups. However, of all cats that exhibited this (or any reported) trait, greater than 50% of owners reported it as neither majorly nor minorly problematic.
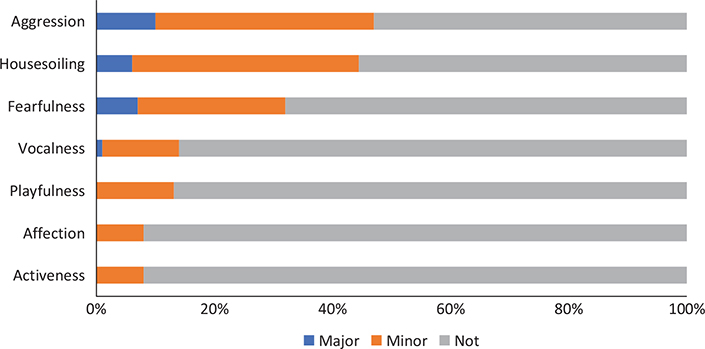
Fig. 2. Percentage of reported behaviors in shelter cats that were reported as a majorly, minorly, or nonproblematic. Data represent all cats (regardless of group) for whom their adopter reported > 1 on the Likert scale for that trait.
Fisher’s exact tests of cats’ responses, stratified by FSA score, to the approach or petting by a stranger or the adopter revealed some differences between groups (Fig. 3a and b). Differences in sample size reflect removal of individuals that responded ‘I don’t know’ to the question (maximum 1 per FSA bin). When asked how their cat responds to a stranger’s approach, all FSA cats were more likely than the controls to already be hiding. Control cats were more likely to respond by approaching a stranger or remaining in place. Similarly, when approached by their owner, FSA 1&2 cats were more likely to run away and FSA 4&5 cats were more likely to be hiding or run away than controls. Control cats were more likely to respond by approaching the owner. Cats with FSA 1&2 were significantly less likely to enjoy owners petting and more likely to avoid petting than all other FSA groups and control cats. All FSA cats were more likely to avoid and less likely to enjoy strangers attempts to pet compared to controls. Control cats were more likely to enjoy both owners and strangers petting and less likely to avoid petting than all FSA groups.
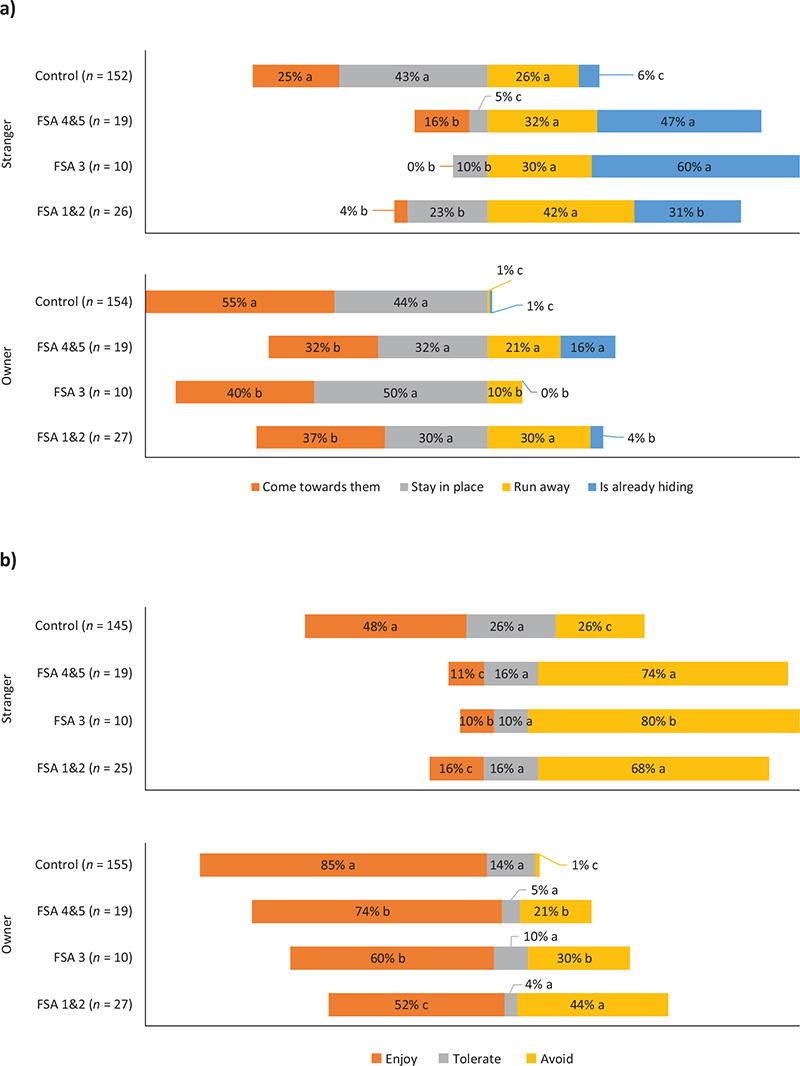
Fig. 3. Shelter cats’ reported response to the approach (Fig. 3a) or petting (Fig. 3b) of either a stranger or the owner stratified by how likely to be socialized they were found to be by the FSA with control (presumably socialized) cats included. FSA 1&2 = Extremely unlikely and Unlikely to be socialized; FSA 3 = Likely to be socialized; FSA 4&5 = Extremely likely and Likely to be socialized; Control = cats never suspected of being undersocialized (and therefore, presumably socialized). Analyses were run on raw data, but percentages are presented in this table to improve interpretability (due to difference in sample sizes). Significance testing is within Likert response levels, between study groups. Values with different superscript levels are significantly different (Fisher’s exact test; α = 0.05).
The majority of adopters (70–97%) were either satisfied or highly satisfied (scores 4–5) with their adoptions in all FSA groups and the control (Fig. 1). While FSA 1&2 adopters reported significantly lower odds of a level 5 satisfaction, 59% scored their satisfaction at this level and a majority of the remainder (30%) scored their satisfaction at level 4.
When adopters were asked what they thought the most appropriate housing for their cat would be, a typical home environment was the favored housing method (60–94%) for all FSA groups and the control (Fig. 4). However, cats with FSA 1&2 scores had a significantly higher percentage (19%) of adopters reporting that the outdoors would be better housing. Cats with FSA 3 had a significantly lower percentage (60%) of adopters reporting standard housing was the most appropriate and instead adopters reported higher levels of uncertainty about appropriate housing (30%).
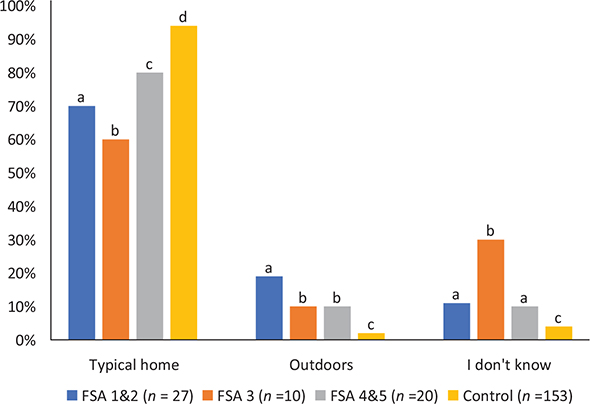
Fig. 4. Best housing for shelter cats as reported by adopters stratified by how likely to be socialized they were found to be by the FSA with control (presumably socialized) cats included. FSA 1&2 = Extremely unlikely and Unlikely to be socialized; FSA 3 = Likely to be socialized; FSA 4&5 = Extremely likely and Likely to be socialized; Control = cats never suspected of being undersocialized (and therefore, presumably socialized). Analyses were run on raw data, but percentages are presented in this table to improve interpretability (due to difference in sample sizes). Significance testing is within Likert response levels, between study groups. Values with different superscript levels are significantly different (Fisher’s exact test; α = 0.05).
Discussion
This study provides evidence that cats never suspected of being undersocialized (and therefore, are presumably socialized) experience better welfare than undersocial cats, that their adopters are more satisfied, and that their adopters are more certain the adoption was in the cat’s best interest. For most variables, these results are more pronounced for cats found more likely to be undersocial by the FSA.
Prolonged periods of exhibiting fear can be indicative of high stress/poor welfare, while positive interactions with humans can be indicative of low stress/good welfare24–26 for cats in a home environment. Cats who were identified as needing an FSA were rated as significantly more fearful and less affectionate by their owners than were cats from the control group, particularly cats in the FSA groups least likely to be socialized. This suggests that cats in these groups (FAS 1&2) had the highest stress and lowest welfare.
By nature of their socialization history, it is likely that undersocial cats will always be fearful of unfamiliar people.27 However, it is commonly suggestedb that they can and will form strong bonds with their primary caregiver. If this is true, then the periods of fear would not be prolonged and instead be restricted to times when they encounter unfamiliar people (visitors to the house, vet trips, etc.) and be more relaxed and interested in friendly interactions with their primary caregivers. In this scenario, one could expect that the cat would have a strongly negative response to attempts made by strangers to approach and pet them but would have a strongly positive response to attempts made by their primary caregiver to approach and pet them. Since exposure to strangers is limited in the lives of most cats, then they may still have good welfare overall, punctuated by periods of acute stress. However, in this study, this was not shown to be the case. While control cats were significantly more likely to have a positive response and less likely to have a negative response to approach and petting from strangers than FSA cats (as expected), cats from all FSA bins were less likely to come toward their owner’s approach and more likely to avoid the owner’s attempts to pet them than control cats. It is worth noting that the majority of FSA cats at each level (55–90%) came toward or stayed in place when their owner approached, compared to the 10–27% that came toward or stayed in place when a stranger approached. However, control cats came toward or stayed in place when their owner approached in 99% of cases, while 68% responded the same way to a stranger. Therefore, while FSA cats did not exhibit comparable behavior toward their owner as control cats, the difference in their behavior between owner and stranger was more pronounced. While this may lend some credence to a ‘special relationship’ with their primary caregiver, it is not necessarily evidence of the types of ‘positive interactions with humans’ that can be indicative good welfare24–26 established above. Staying in place when their owner approaches, for example, may simply be evidence them having learned that their owner does not present a threat, and that may be the extent of this ‘special relationship’. More participatory forms of positive interactions with humans such as evidence of enjoying petting would present better evidence to suggest that these cats are experiencing good welfare and are well adapted to this environment.
While FSA 1&2 cats responded similarly to their owner’s approach to other FSA groups, they had a particularly worse response to the owner’s attempts at petting than all other groups – in fact 44% of cats in this group avoid petting from their owner (compared to 30% in the next closest FSA group, and 1% of control cats). While cats can certainly have good welfare in the absence of petting, 34% of FSA 1&2 cats also run and hide or are already hiding when their owner approaches them, which is likely to be a very common occurrence in a home (even if approach is unintentional). This suggests these cats live in prolonged periods of fear and do not have positive interactions with humans (two of the hallmarks for poor welfare established earlier), likely because they are not well adapted to this environment. Owners of cats assessed by the FSA were also less likely to report their cats would be happiest in a traditional home environment (all FSA bins, but particularly FSA 1&2 and FSA 3) and more likely to answer ‘I don’t know’ (all FSA bins, but particularly FSA 3) or that the cat would be happiest outdoors (all FSA bins, but particularly FSA 1&2) than owners of control cats. That these owners questioned if their home was in the best interest of their cat’s happiness suggests that they had concerns about their cat’s welfare.
Owner satisfaction is important for pet retention, but more so, animal shelters should aim to work both in the best interests of the pets in their care and the human members of their community adopting these pets. If a population of pets are associated with poor adopter satisfaction, then it is unlikely these placements are resulting in human-animal bonds that meet the needs of either cat or adopter. In recent studies, the percentage of cat adopters reporting satisfaction comparable to ‘very satisfied’ range from 72.428 to 94.6.28–30 In the present study, adopters of cats in the control group and FSA 4&5 reported high satisfaction within this range (83 and 85%, respectively), while adopters of cats in FSA 3 and FSA 1&2 reported high satisfaction well below this range (60 and 59%, respectively). This is likely explained by the high degree of fear and low degree of affection reported in these groups, which previous studies have found to be related to satisfaction.31–34 Although satisfaction ratings from adopters of cats in FSA 3 and FSA 1&2 were lower than other groups, most still reported a satisfaction rating of 4 or above, despite their cat’s elevated fear and low affection. This may be an indication that the adoption resulted in a human-animal bond that does not quite meet the adopter’s desires (very satisfied) but met their base needs (satisfied) because any behavior problems present were not deemed majorly problematic.
Significant differences in return rates between groups may suggest a difference in adopter experience or satisfaction. Return adoptions may take place for a range of reasons unrelated to behavior although at least two studies found behavior to be the most common reason for cat return adoptions.35,36 In the current study, there was no difference in the percentage of cats returned in the control group and the FSA group (both 14%). This is surprising considering the difference in fearfulness between the two groups, which was found to be the second leading behavioral reason for return in one study.35 It is possible that behavior disclosures and adoption counselling sessions calibrated the adopters’ expectations of the FSA cats’ behavior. This may have contributed to the fact that while adopters of FSA cats reported lower rates of being very satisfied, but they did not report significantly higher rates of being dissatisfied.
There are limitations to this study that must be acknowledged. Trait rating and scenario data from the survey rely on owner interpretation and prediction of cat behavior and thus may be subject to cognitive biases. However, cat owners have been found to be very reliable at rating cats on temperament traits that predict the reaction their cat will have to stimuli.37,38 The adopter satisfaction question in the current study was posed in a way comparable to other studies,29,30 but it is easy to question if adopters are able to answer honestly or if feelings of guilt39 lead them to suggest they are more satisfied than they truly feel. Perhaps attempts to extract this information using language that is less likely to make the owner feel judged (e.g. Cat Satisfaction Scale32) may have resulted in a larger difference between groups. It is also possible that ‘satisfaction’ in itself is too a low bar to properly identify differences between adopters, as it may be interpreted as ‘good enough’. Regardless, significant differences in adopter satisfaction were identified in the current study even with the potentially flawed question. Within this study, cats are classified and compared by how they scored on the FSA, conducted as soon as possible on arrival at the facility, but no attempt was made to compare adopter responses based on other variables (such as whether or not they spent time in a foster home, how much progress they made in their behavior modification plans before adoption or length of stay). It is possible that one of these variables would have been an even better predictor of survey responses than FSA group. Cats had to be in their adopted home for at least 1 month to be included in the current study. While it is possible that 1 month was not enough time for the cats to habituate to their new environment, this conservative time frame was chosen as previous research indicates cats from a hoarded environment had increases in social behavior in data collected >1 week post-adoption.2 Perhaps the most marked limitation to this study was related to the line of inquiry about how big a problem each trait was. Adopters were not asked how big of a problem each trait was if they indicated it was absent. This seems very logical when considering the trait ‘aggressive’ as it is highly unlikely that any adopter would consider an absence of aggression as problematic. However, for some traits, notably affection, absence could easily be a big problem. In these cases, the people reporting an absence of affection were not asked how big of a problem they found the absence to be. This is particularly unfortunate as affection was one of the only traits found to be significantly different between groups and could conceivably give additional insight into the adopter’s experience.
Conclusion
Cats identified for assessment with the FSA were more fearful, less affectionate, less amenable to approach and petting (more so by strangers but also by their owner), and had less satisfied owners who were more likely state their cats would be happiest in an outdoor environment than cats who were not identified for assessment with the FSA. For most of these findings, the significance was correlated with how likely to be socialized they were found to be by the FSA. The FSA cats showing fearful responses to strangers’ attempts at approaching and petting supports the idea that they are less socialized than cats in the control group, but the FSA cats’ fearful responses to their owners’ attempts at approaching and petting supports the idea that they have poorer welfare than cats in the control group, since this suggests that they are likely to be in a state of fear frequently. These findings suggest that although it is becoming increasingly possible to find adoption homes for poorly socialized cats, it does not appear to be in the best interest of many of these cats or adopters. The results of the FSA may be helpful for making pathway decisions for each cat and setting adopter expectations after habituation in the home. While there is no clear cut-off point indicating what FSA levels do poorly in homes, evidence (fear, owner approach and petting, satisfaction, environment they would be happiest) suggests that at least FSA 1&2 should be slated for TNR or barn placement unless significant progress is made in shelter.
Authors’ contributions
Study conceptualization and funding acquisition completed by JJE. Data collection completed by NF. Data curation and analysis completed by KJJ. Writing – original draft was completed by JJE and KJJ. Writing – review and editing was completed by all authors.
Acknowledgments
The authors would like to thank the Canada Summer Jobs program for funding the research assistant during data collection.
Author notes
The content in this manuscript has been previously presented at the American Board of Veterinary Practitioners 2024 Symposium and the Animal Behavior Society 2024 conference.
References
| 1. | Kraft W. Geriatrics in Canine and Feline Internal Medicine. Eur J Med Res. 1998;3(1–2):31–41. |
| 2. | Jacobson LS, Ellis JJ, Janke KJ, Giacinti JA, Robertson JV. Behavior and Adoptability of Hoarded Cats Admitted to an Animal Shelter. J Feline Med Surg. 2022;24(8):e232–e243. doi: 10.1177/1098612X221102122 |
| 3. | Seo A, Ueda Y, Tanida H. Health Status of ‘Community Cats’ Living in the Tourist Area of the Old Town in Onomichi City, Japan. J Appl Anim Welf Sci. 2022;25(4):338–354. doi: 10.1080/10888705.2021.1874952 |
| 4. | Halls V, Bessant C. Managing Cat Populations Based on an Understanding of Cat Lifestyle and Population Dynamics. JSMCAH. 2023;2(S1):1–11. doi: 10.56771/jsmcah.v2.58 |
| 5. | Slater M, Garrison L, Miller K, Weiss E, Drain N, Makolinski K. Physical and Behavioral Measures that Predict Cats’ Socialization in an Animal Shelter Environment during a Three Day Period. Animals. 2013;3(4):1215–1228. doi: 10.3390/ani3041215 |
| 6. | Slater M, Garrison L, Miller K, Weiss E, Makolinski K, Drain N. Reliability and Validity of a Survey of Cat Caregivers on Their Cats’ Socialization Level in the Cat’s Normal Environment. Animals. 2013;3(4):1194–1214. doi: 10.3390/ani3041194 |
| 7. | Slater M, Garrison L, Miller K, et al. Practical Physical and Behavioral Measures to Assess the Socialization Spectrum of Cats in a Shelter-Like Setting during a Three Day Period. Animals. 2013;3(4):1162–1193. doi: 10.3390/ani3041162 |
| 8. | Slater MR, Miller KA, Weiss E, Makolinski KV, Weisbrot LAM. A Survey of the Methods Used in Shelter and Rescue Programs to Identify Feral and Frightened Pet Cats. J Feline Med Surg. 2010;12(8):592–600. doi: 10.1016/j.jfms.2010.02.001 |
| 9. | Slater MR. The Welfare of Feral Cats. In: Rochlitz I, ed. The Welfare Of Cats. Animal Welfare. Springer Netherlands; 2007:141–175. doi: 10.1007/978-1-4020-3227-1_6 |
| 10. | Eagan BH, Van Haaften K, Protopopova A. Daily Gabapentin Improved Behavior Modification Progress and Decreased Stress in Shelter Cats from Hoarding Environments in a Double-Blind Randomized Placebo-Controlled Clinical Trial. J Am Vet Med Assoc. 2023;261(9):1305–1315. doi: 10.2460/javma.23.01.0044 |
| 11. | Karsh EB, Turner DC. The Human-Cat Relationship. In: Knigh V, Bierach K, eds. The Domestic Cat: The Biology of Its Behaviour. Cambridge University Press; 1988:159–177. |
| 12. | Gosling L, Stavisky J, Dean R. What is a Feral Cat?: Variation in Definitions May Be Associated With Different Management Strategies. Journal of Feline Medicine and Surgery. 2013;15(9):759–764. doi: 10.1177/1098612X13481034 |
| 13. | Halls V, Bessant C. Identifying Solutions for ‘Inbetweener’ Cats. JSMCAH. 2023;2(S1):1–13. doi: 10.56771/jsmcah.v2.59 |
| 14. | Ellis JJ. Beyond ‘doing better’: ordinal rating scales to monitor behavioural indicators of well-being in cats. Animals. 2022;12(21):2897. doi: 10.3390/ani12212897 |
| 15. | Converse J, Presser S. Survey Questions. SAGE Publications, Inc.; 1986. doi: 10.4135/9781412986045 |
| 16. | Ruel E, Wagner WE, Gillespie BJ. The Practice of Survey Research: Theory and Applications. SAGE Publications, Inc; 2016. doi: 10.4135/9781483391700 |
| 17. | Yammarino FJ, Skinner SJ, Childers TL. Understanding Mail Survey Response Behavior: A Meta-Analysis. Public Opin Q. 1991;55(4):613. doi: 10.1086/269284 |
| 18. | van Gelder MMHJ, Vlenterie R, IntHout J, Engelen LJLPG, Vrieling A, van de Belt TH. Most Response-Inducing Strategies Do Not Increase Participation in Observational Studies: A Systematic Review and Meta-Analysis. J Clin Epidemiol. 2018;99:1–13. doi: 10.1016/j.jclinepi.2018.02.019 |
| 19. | Brennan M, Benson S, Kearns Z. The Effect of Introductions on Telephone Survey Participation Rates. Int J Mark Res. 2005;47(1):65–74. doi: 10.1177/147078530504700104 |
| 20. | Bosnjak M, Tuten TL. Prepaid and Promised Incentives in Web Surveys: An Experiment. Social Science Computer Review. 2003;21(2):208–217. doi: 10.1177/0894439303021002006 |
| 21. | Gunn WJ, Rhodes IN. Physician Response Rates to a Telephone Survey: Effects of Monetary Incentive Level. Public Opin Q. 1981;45(1):109. doi: 10.1086/268638 |
| 22. | Tuten TL, Galesic M, Bosnjak M. Effects of Immediate Versus Delayed Notification of Prize Draw Results on Response Behavior in Web Surveys: An Experiment. Soc Sci Comput Rev. 2004;22(3):377–384. doi: 10.1177/0894439304265640 |
| 23. | Laguilles JS, Williams EA, Saunders DB. Can Lottery Incentives Boost Web Survey Response Rates? Findings from Four Experiments. Res High Educ. 2011;52(5):537–553. doi: 10.1007/s11162-010-9203-2 |
| 24. | Amat M, Camps T, Manteca X. Stress in Owned Cats: Behavioural Changes and Welfare Implications. J Feline Med Surg. 2016;18(8):577–586. doi: 10.1177/1098612X15590867 |
| 25. | Casey RA, Bradshaw JWS. The Assessment of Welfare. In: Rochlitz I, ed. The Welfare of Cats. Animal Welfare. Springer Netherlands; 2007:23–46. doi: 10.1007/978-1-4020-3227-1_2 |
| 26. | Vojtkovská V, Voslářová E, Večerek V. Methods of Assessment of the Welfare of Shelter Cats: A Review. Animals. 2020;10(9):1527. doi: 10.3390/ani10091527 |
| 27. | McCune S. The Impact of Paternity and Early Socialisation on the Development of Cats’ Behaviour to People and Novel Objects. Appl Anim Behav Sci. 1995;45(1–2):109–124. doi: 10.1016/0168-1591(95)00603-P |
| 28. | Onodera N, Uchida K, Kakuma Y. Association between Characteristics of Cats and Satisfaction of Owners Who Adopted Cats from an Animal Hospital in Japan. J Vet Med Sci. 2014;76(5):729–733. doi: 10.1292/jvms.12-0569 |
| 29. | Scott S, Jong E, McArthur M, Hazel SJ. Follow-Up Surveys of People Who Have Adopted Dogs and Cats from an Australian Shelter. Appl Anim Behav Sci. 2018;201:40–45. doi: 10.1016/j.applanim.2017.12.021 |
| 30. | Zito S, Paterson M, Vankan D, Morton J, Bennett P, Phillips C. Determinants of Cat Choice and Outcomes for Adult Cats and Kittens Adopted from an Australian Animal Shelter. Animals. 2015;5(2):276–314. doi: 10.3390/ani5020276 |
| 31. | Neidhart L, Boyd R. Companion Animal Adoption Study. J Appl Anim Welf Sci. 2002;5(3):175–192. doi: 10.1207/S15327604JAWS0503_02 |
| 32. | Elvers GC, Lawriw AN. The Behavioral Style of the Cat Predicts Owner Satisfaction. Anthrozoös. 2019;32(6):757–768. doi: 10.1080/08927936.2019.1673038 |
| 33. | Normando S, Venturini T, Filugelli L, Bonetti O, Mutinelli F, Contalbrigo L. Cat-Human Bond: Satisfaction and Behavioural Complaints Among Italian Respondents. Appl Anim Behav Sci. 2022;256:105749. doi: 10.1016/j.applanim.2022.105749 |
| 34. | O’Connor R, Coe JB, Niel L, Jones-Bitton A. Exploratory Study of Adopters’ Concerns Prior to Acquiring Dogs or Cats from Animal Shelters. Soc Anim. 2017;25(4):362–383. doi: 10.1163/15685306-12341451 |
| 35. | Casey RA, Vandenbussche S, Bradshaw JWS, Roberts MA. Reasons for Relinquishment and Return of Domestic Cats (Felis Silvestris Catus) to Rescue Shelters in the UK. Anthrozoös. 2009;22(4):347–358. doi: 10.2752/089279309X12538695316185 |
| 36. | Mundschau V, Suchak M. When and Why Cats Are Returned to Shelters. Animals. 2023;13(2):243. doi: 10.3390/ani13020243 |
| 37. | Mertens C, Turner DC. Experimental Analysis of Human-Cat Interactions During First Encounters. Anthrozoös. 1988;2(2):83–97. doi: 10.2752/089279389787058109 |
| 38. | Travnik IC, Sant’Anna AC. Do You See The Same Cat That I See? Relationships between Qualitative Behaviour Assessment and Indicators Traditionally Used to Assess Temperament in Domestic Cats. Anim Welf. 2021;30(2):211–223. doi: 10.7120/09627286.30.2.211 |
| 39. | Buller K, Ballantyne KC. Living with and Loving a Pet with Behavioral Problems: Pet Owners’ Experiences. J Vet Behav. 2020;37:41–47. doi: 10.1016/j.jveb.2020.04.003 |
Footnotes
a. https://www.alleycat.org/resources/cat-socialization-continuum-guide/
b. e.g. https://americanpetsalive.org/uploads/resources/BFAS-Socializing-Cats-that-are-nonsocial-to-humans52F6.pdf